Testing Latency in the Portal
Internal Latency
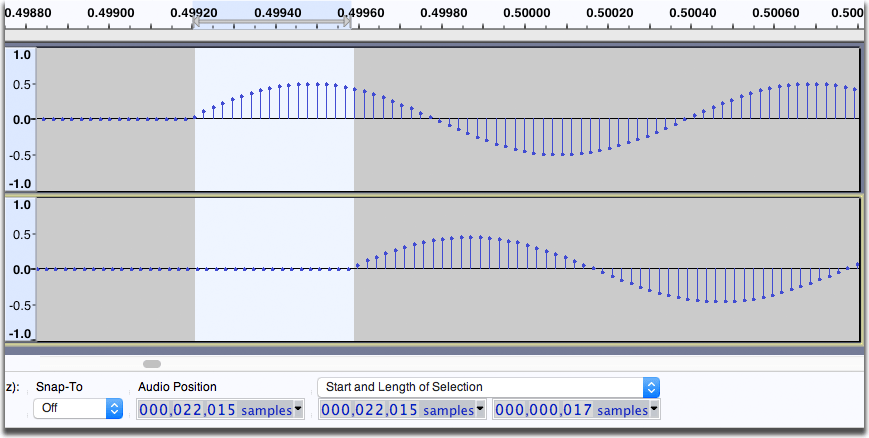
For the internal latency tests, we used the Audacity tutorial but keeping the distance from the mics to speakers the same. The basic idea is that we opened an instance of Audacity and generated a click-track to send through the speakers which was then recorded by the mics and received into Audacity as another track. We then measured the average difference in time between these two tracks.
Oslo
In Oslo, it was fairly easy to install Audacity on the LOLA machine and properly route the inputs and outputs and send some click-tracks through. After ten measurements, we found the latency to be around 27-28 ms. This was quite similar in Trondheim, however, the latency of the mixer and LOLA computer is something to consider here, along with the distance between the speakers and microphones mounted above (about 2m).
Trondheim
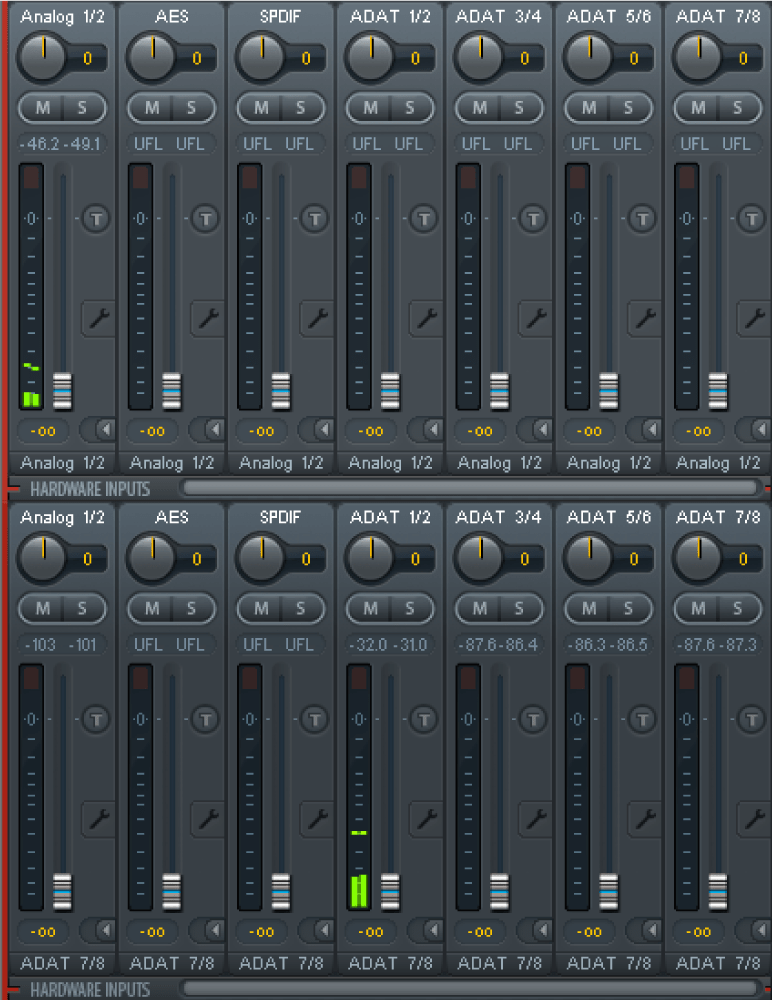
As Audacity doesn’t accept Asio as audio driver, very few audio device manipulations are possible. We discovered that the audio is routed to the Analog 1/2 channel in Oslo, while in Trondheim the sound is coming from ADAT 1/2. Without Asio, it was impossible to choose the latter as audio input in Audacity. For that reason, we had to download and use Reaper in Trondheim. But the latency testing process was the same. We obtained a latency of 25 ms.
Zoom latency
We measured the latency in Zoom using Zoom’s built-in utility for “Meeting and Phone statistics”. We connected a client from the Portal in Oslo to a separate client in Trondheim, through Ulrik’s computer. We then measured different data, i.e. audio latency, bitrate, jitter, packet loss, etc. over time and averaged the results. As we were primarily interested in audio latency, we did some brief notes on the variance in the measurements. We also experimented by adding more clients to see how that affected the latency.
The constants that we used to measure the end to end latency:
| Location | m | ms |
|---|---|---|
| Midas | 1 | |
| Distance mouth to mics Oslo | 2 | 5.8 |
| Distance mouth to mics Trondheim | 1.5 | 4.4 |
| Distance speakers to ears Oslo | 3 | 8.7 |
| Distance speakers to ears Trondheim | 5.2 | 15.5 |
Results
| Zoom condition | Only Zoom | Zoom + distance (mic and speakers) | Zoom + distance + Midas |
|---|---|---|---|
| Trondheim sending (AVG) | 35.5 | 39.9 | 40.9 |
| Trondheim receiving (AVG) | 38 | 51.5 | 52.5 |
| Oslo sending (AVG) | 25.8 | 31.8 | 32.8 |
| Oslo receiving (AVG) | 23.5 | 32.3 | 33.2 |
As can be seen in the table above, the total end to end latency ranges from 32.8 ms - 52.5 ms, depending on the local configuration.
Regarding the other data measurements (jitter, packet loss, video resolution etc.), we noticed that latency varied the least. It seems like Zoom’s algorithms prioritize maintaining a constant low latency over e.g. good video resolution.
One surprising result that came up during these measurements were the acoustic latencies from the speaker/listener to microphone/loudspeakers, respectively. The distance from the speakers to the audience in Trondheim is approximately equal to half of latency of sending that same audio between the two cities. While our minds have been focused on optimizing network latency, it suddenly became apparent that there are obvious acoustic latencies that could be optimized as well. The long distance from loudspeaker to ear in Trondheim can be improved by sending the incoming Lola audio to some loudspeakers that are closer to our ears (around 1.5 meters), which would reduce the end to end latency for the audience in Trondheim by close to 12 ms, from the calculation (5.5 - 1.5)/340 * 1000 = 11.76 ms.