a t-SNE adventure
Idea
The goal of this project was to develop a system for interactive exploration of sound clusters. More specifically, I wanted to extract features from sounds, cluster them together in a virtual 3D space with t-SNE [1][2], and make an interactive environment for exploring these sounds.
The idea was initially sketched out with an optical tracking system in mind,i.e. Optitrack. Due to the circumstances of Covid-19, the available technologiesfor tracking motion were either mobile phone sensors or web camera by usingcomputer vision algorithms to extract motion data. As one of the main conceptsof the project was to make use of a 3D space, the choice quickly landed onphone sensors, since they are readily available to extract data from in threedimensions.
Result
The video below is a quick demonstration of the end result.
The Max patch controls the visual and auditory elements. It communicates with a Python script that receives sensor values from the phone as OSC, and then processes the data.
Source code: https://github.com/ulrikah/tsne-adventure
Method
The initial plan for the interactive environment was to create a 1:1 room-scale virtual mirror of an actual room, e.g. a living room. By using a phone to trigger samples through measurements of the jerk (derivative of acceleration), the user would then be able to move around in the room and explore the sounds. With an optical tracking system, there would be no need for a phone to do this. Instead, one could use a suitable physical object, e.g. a drumstick, attach a reflective marker to it, and then use the jerk of that marker to determine a hit.
Extracting position from the phone sensors (by double integration of the accelerometer values) turned out to be more difficult than expected. The complications were mainly related to noisy accelerometer values and corresponding drifting. After a couple of failed attempts to try to obtain a smooth experience by going through resources provided by the course professor, I decided to use the gyroscope in the phone to control the position instead. The way I ended up doing this was by mapping the pitch, yaw and roll to the velocity vector of a virtual controller object, inspired by ball-in-a-maze puzzles. In the figure below, the orange object represents this controller object. The grey spheres are samples.
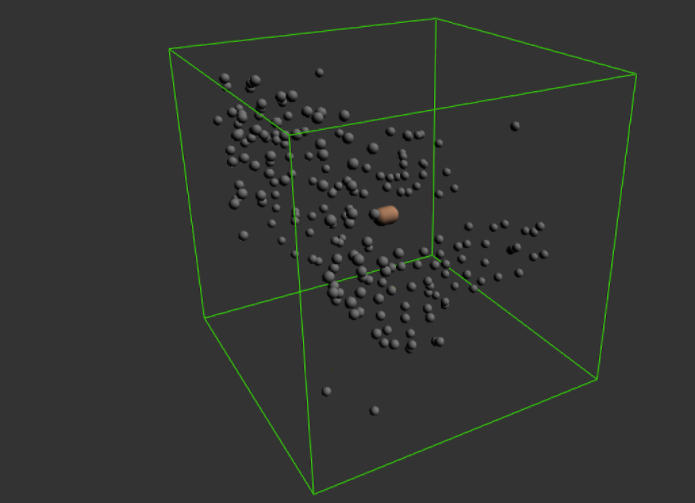
To trigger the samples, I used the jerk value from the accelerometer sensor. Jerk is the rate of change of acceleration, and can be derived in both x, y and z axis. By performing an abrupt movement that causes a jerk value over a certain threshold in any of the axis, the user triggers the sample to which the controller (see the orange blob in the figure) is closest to. Intuitively, this is similar to a typical percussive instrument, where the musician hits a surface to make sound. This method of triggering samples was inspired by last year’s motion tracking project. The jerk threshold was set by trial and error.
To determine which sample to trigger, I picked the sample with the lowest euclidian distance to the controller object.
To avoid that successive jerk values triggers the same sample too frequently, I also added a cooldown of 200 ms between each sample trigger.
Reflections and future work
The most apparent problem for interacting with the system is the way the position is currently being controlled by the orientation of the phone. This would naturally be solved by replacing the control method with an optical motion tracking system.
By only using the euclidian distance to determine which sample to be triggered, I realised that I often found myself triggering the same samples over and over again. To be able to better explore a sound cluster, I would look into adding some randomness into the sample selection. One way of doing that could be to do some weighted random selection of the closes N samples. It is also possible that this issue would resolve itself by using the optical tracking system, as it allows for finer control of position.
In terms of interaction and user feedback, I would like to improve the visual aspects of the patch as well. In particular, coloring the currently playing audio samples should be a top priority.
Due to the multifaceted nature of the project, the auditory output of the system was not the main priority. I would like to experiment a lot more with different ways of manipulating the sound. Further work on the project should also focus on finding a better way of triggering samples. The current solution is rendering the audio buffers at runtime, which is not ideal at scale. Additional gain normalization, filters and envelopes should also be implemented.
Clustering
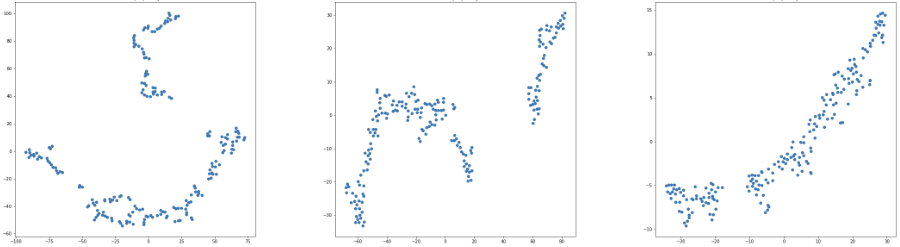
To cluster the files, I used an implementation of the t-distributed Stochastic Neighbor Embedding algorithm (t-SNE) from scikit-learn. t-SNE’s strength is visualising high-dimensional data [1]. For this project, I extracted features based on root mean square value of the audio signal, mel-frequency cepstrum, spectral contrast and spectral centroid.
The end result, as seen in figure of the virtual model, does not contain many distinct clusters, which was a bit disappointing. Perhaps it was due to the relatively sparse feature extractors. Even though I experimented with a range of different perplexity values to get the best result (see figure below), I would like to try other methods of clustering in the future. One possibility that I thought of at the very end of the project was to choose a set of exactly three features, and to map the samples according to the mean values of those features, each representing an axis in the 3D space. In that way, the sample would be distributed linearly on the axes by some known feature extraction method. This could potentially make it more understandable for the user why the samples are placed where they are. Future work could also include looking into ways of letting the user change the feature extractors themselves.
References
- Laurens van der Maaten and Geoffrey Hinton. Visualizing data using t-SNE. Journal of machine learning research, (Nov):2579–2605, 2008
- Wattenberg, M., Viégas, F., & Johnson, I. (2016). How to use t-SNE effectively. Distill, 1(10), e2. https://distill.pub/2016/misread-tsne/