Chaotic Battle of Music Slices
Task Overview
The task for the final exam for scientific computing was requires us to write a Python program which sequences audio segments extracted from two selected songs according to arbitrary analytical criteria. The program takes as input two audio files, each containing a song you select, and it produces as an output audio file, a visualization of the sequenced audio, a CSV file with details of the all audio segments, and several metrics printed on screen.
Solution Overview
My solution was to import two audio files into a panda data frame after slicing them rhythmically, sorts and reorganizes slices using the four kinds of calculated Librosa features as the principle.
The segmentation strategy: Slicing an audio signal in segments of fixed and duration related to the tempo and arranging them on Numpy array.
The sorting strategy: Four audio features(spectral_contrast, spectral_rolloff, spectral_centroid, rms) are computed using Librosa for each slice, and the results were summed at 30%, 30%, 35%, and 5%, listed in ascending order to reorganizes slices.
I chose to use two songs I created myself a long time ago, and I chose two pieces of music with completely different styles and rhythms in order to make the reassembled music clueless! The material of the first song was only a piece of knocking on the glass, and it was an electro-acoustic music created by Kyma and GRM Tools. The other song is a more “popular” EDM, which is an undergraduate classwork 4 years ago.
Regarding reorganized music, I was aware of the challenges of slicing and recombining two pieces of music in terms of audibility, so I simply tried to construct new music in a more chaotic way.
As messy as possible!
To be honest, after tried to calculate multiple features, it was difficult to completely decomposition two different pieces of music in reorganized music(features of the slices from one music will be more similar). Therefore, I tried to use different weights for multiple types of data to make the fragments as messy as possible. After I added these data proportionally, It is not particularly clear what it means in terms of hearing. But two different styles of music mixed together in a seemingly clueless way!
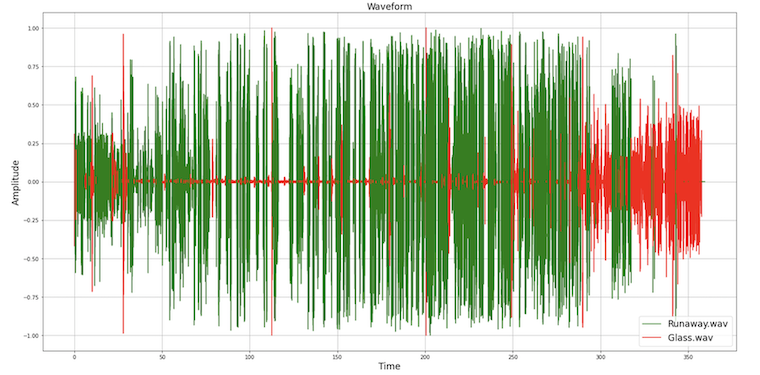
In the solution for visualising audio files, I chose to use different colours to mark the source files of the music clips. In order to make the source of each slice clear enough, I used matplot to output a really huge png file, and the original png file can be download in here.

My reflection
As a beginner in programming, this semester’s python course was undoubtedly the most difficult and time consuming course for me to learn. However, the completion of this final exam went relatively smoothly overall, and I was able to complete the program’s goal in a relatively quick time (although stuck on how to sort audio sources visually for a long time)
I also wrote two versions of the program during the exam, the first version was a linear build of the program as I had done before but the program was fairly hard to read and did not fit the reusability of the program. So, after finishing the goal, I tried to learn to construct the program like an experienced programmer, writing various functions to achieve different purposes for program. Obviously, this is a much more efficient and clearer way of building programs. For me, the next step in my learning might be to learn how to build programs from this kind of “bigger view” from the start.
All in all, this semester’s study of python has certainly been a very fascinating and rewarding course for me, and I hope to be able to go further in the future.
