Slicing and Dicing Audio Samples
The Task
The task for the final exam for scientific computing was to create a python program that splits up two songs into segments, analyses particular audio qualities of these segments, then uses this analysis to determine the order when reassembling these segments back into a single audio file. The final audio file then needs to be displayed in a plot, with some indication of the audio samples used and audio feature values.
The Implementation
My Idea was to combine two features, RMS and Spectral Centroid.
The program calculates the Spectral Centroid value (brightness of a sound) and average RMS (loudness) of each segment. It then multiplies these values together so that we can order the samples from high loudness and high brightness to low loudness and low brightness.
I chose to use two songs I created myself. They are both cover versions of the same song, but in very different styles, so the tempo, chords and overall structure are the same but all the instrumentation is different.
Rather than just reconstructing the samples from bright/loud to dull/soft, the samples are re-orderd so that each consecutive sample is a bright/loud sample followed by a dull/soft sample. In this way it is a bit more “musical” since the final output has a kind of loud beat followed by soft off-beat feel.
It’s interesting to note that there is no clear indication of what sound is on the beat and what sound is on the off-beat, allowing the listener to change their focus, which creates quite a different experience based on whether you choose the soft or loud segments as the beat.
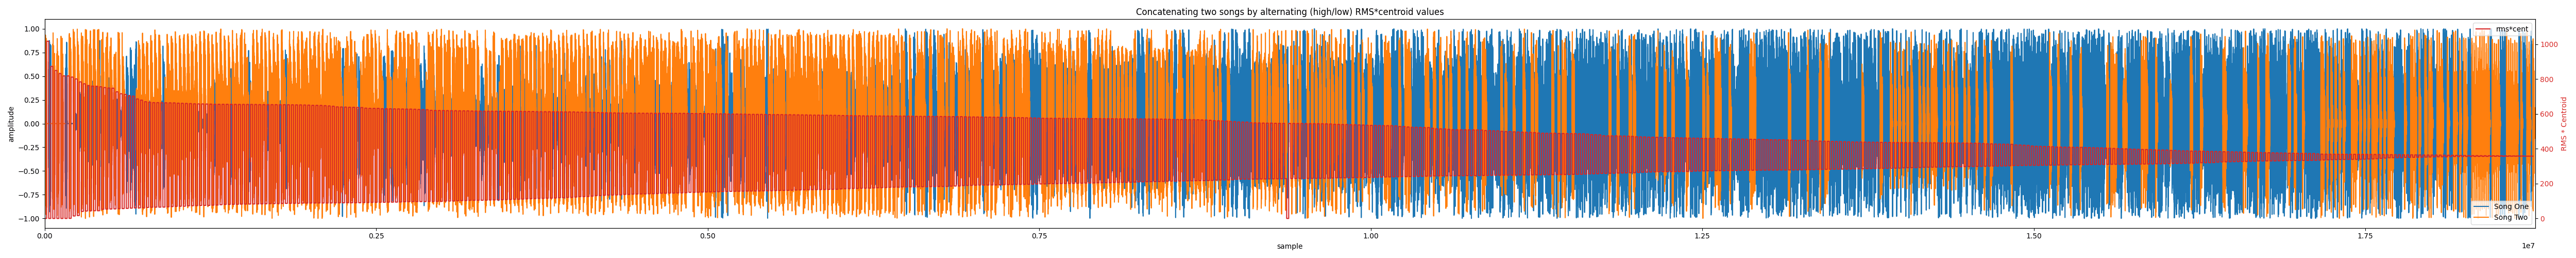
In the visualisation I chose to colour code the samples based on which song they originally came from. Overlayed on top of the samples is the RMS * Spectral Centroid values for each sample, and since this value alternates from high to low, the vertical line this creates indicates the end of the previous sample and the start of a new sample.
This visualisation can be seen below. Open in a new tab or download to see the full resolution image.
Final Thoughts
It’s interesting to notice the difference in “dynamics” between the two versions of the song. As can be seen in the output image, song two is mostly placed at the start of the output audio file and contains significantly brighter/louder and duller/softer segments than song one, which has much less contrast between its bright/loud and dull/soft segments.
This was also interesting for me to hear how many segments of my two songs are literally identical. When placed within the context of the original songs this isn’t as noticable but when similar segments of a song are grouped together based on audio features that they have in common, it really stands out how repetitive some of these beats are. I think I will take this knowledge on board and try to incorporate some more variables in my future tracks to make them sound a bit more “human”.