Dark Tetris
What?
The final assignment in the Scientific Computing module was to take out self-chosen audio segments from two audio files, to analyse their features and to combine them into one audio file. We also needed to visualise both songs and the slicing points and create a new csv file with the features that we have analysed with the help of the Librosa library.
What resulted?
I merged a piece of music from the game Tetris and a song called Veil of Elysium, originally by a power metal band called Kamelot. Originally, I wanted to merge “Tetris” with the other song so as to give it a heavy metal quality, meaning that the rather cute sounding Tetris would become darker and heavier. Very unsurprisingly, as a novice Pythonista here, I ended up putting the “epic” (a style of Heavy Metal) beginnings of the two audio files into one. In addition, I focused on the downbeats (onsets) and set as a ¼ tempo.
The version of Tetris I used was performed by London Philharmonic Orchestra and the recording of Veil of the Elysium was performed by the American power metal band called Kamelot. Both songs are in the Allegro to Vivace range (120 - 156 bpm), the average tempo is at 130 bpm. The expressions of both songs are quite different despite the fact that they both share rather epic introductions. Tetris is playful and Veil of Elysium is tense and a bit dystopian. The genres of both songs are obviously very different, however, from the music psychology point of view, the complexities of both genres are very similar and attracted similar listeners, such as introverts, whose minds crave for complexities and enjoy swimming in their train of thoughts. I have extracted the most epic beginnings from both files and simply put them together. (Feel free to laugh, it is a non-programmer way of doing programming).
Process and Why:
As I just mentioned with the onsets and tempo, these are the segments I have sliced, in a hope that it will make the downbeats clearer. The visualisation of this is, to be honest, quite boring, as you can see as below:
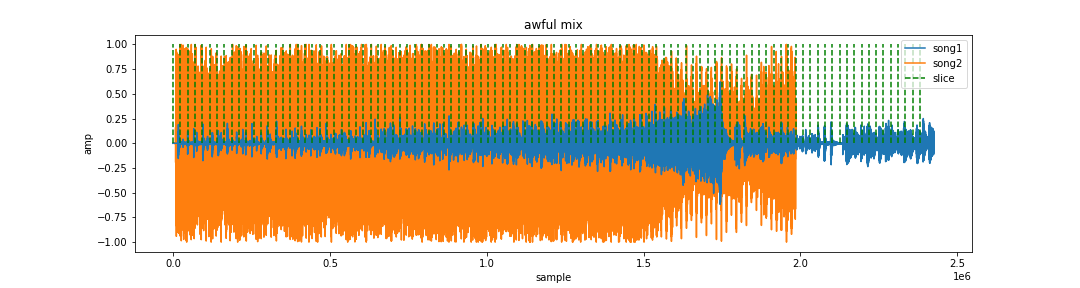
Then, I extracted their average root-mean-square (RMS) and spectral centroids levels and created a new CSV file. While RMS quantifies the average level of a signal, RMS correlates more closely to our hearing, in this sense, I considered the timbre of both audio files. The spectral centroid is simply a measure used to characterise a spectrum of the digital signal it processes. In a nutshell, it indicates where the core spectrum is located - the brightness of a timbre. So, I tried to make the downbeats of the remix file clearer and brighter in its timbre.
Lessons Learned:
I have to admit that I didn’t understand the array until this assignment, I finally learned how to play with it and twist it in order to program the ideas I have in my head. There is a lot to be explored in the audio field. Coming from the social sciences, humanities and architecture and design backgrounds, it took quite a while before I began to grasp the computing languages and communication styles. I noticed how terms have different meanings in different things in other fields, I also gained new insights by communicating with Team C.
Ending with this small reflection of my final assignment for Sci-Com, I want to say thank you for the teaching program that was constantly improving and tailored for different types of learners. I have to admit that as a creative learner, thinking about spaces and visual terms are way easier than following verbal concepts step-by-step. I feel that the program changed along the way, and it helps my learning. Last but not least, I want to thank Stephen from Team C, who took his time and patience to help and explain with the codes in the past few weeks. Without these collaborations, I would have found it hard to even finish the task. (Even if there will be a lot of weird errors, it is better than an incomplete assignment.)