Valkyrie: Aurora Sonified

Valkyrie:
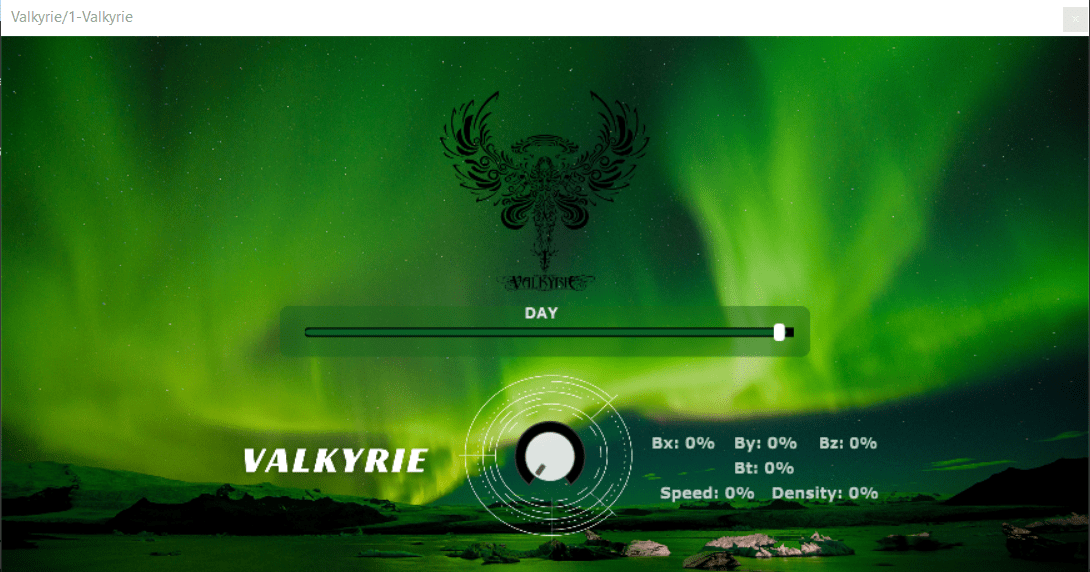
Who are Valkyries? Are they those fierce warriors who serves the god Odin and is sent by him to the battlefields to choose the souls who are worthy of a place in Valhalla? Are the sounds that we made coming from her lustrous shield, maybe? Maybe not? Perhaps, the relevant question is what is Valkyrie? It’s a synth we made that sonifies northern lights, the Aurora Borealis, for our sonification course MCT 4046. The Inspiration: A strong sighting of the majestic aurora, here in Trondheim, the science behind how they are formed, and the interesting Nordic mythology were the fuels for it, and so began our quest to chase Northern Lights.
Aurora and its quantification
Our research took us from Nordic mythology to the star of the show, the life giving sun and then to quantifying aurora i.e. how we measure it?
Mythologically aurora’s were considered to be the reflection or the glow from the shields of Valkyries, at some points it was also believed to be the Bifrost bridge that connects all the nine realms of the Norse cosmos. But it was Kristian Birkeland who first explained the science behind aurora borealis
So how are they made?
To understand how they are made we need to go to the centre of the sun. There, the strong magnetic field ejects the hot plasma out which contains highly charged electrons and protons, these particles reach the outers of the solar system as the solar winds, the solar winds constantly vary in speed and density of the charged particles it carries.
When the solar winds encounter earth’s magnetosphere most of the particles are reflected so that they don’t damage our atmosphere. But some of the particles come through in earth’s atmosphere where the magnetic field is weak, which is around earth’s poles. This particle collides with oxygen and nitrogen atoms and excites them, and in the process of cooling down and coming to their normal state they emit photons and produce lights which we call aurora.
What aurora depends on, its measurement and how to read aurora charts?
There are multiple factors on which aurora depends:
- KP Index
- Strength of IMF
- Polarity of IMF
- Density if solar wind
- Speed of solar wind
- Weather
KP Index
This is arguably the most important one, KP Index is an index for geomagnetic activity on earth and is rated on a scale of 0 to 9, where 0 means no activity 5 means minor storm and 9 means severe geomagnetic storm. The number required to see the aurora depends on the altitude you are at, you can check the relation here. Real time kp index can be seen here
Strength of IMF
In the first graph the black line Bt shows the strength of IMF. The higher this value, the better it is for enhanced geomagnetic conditions. We speak of a moderately strong total interplanetary magnetic field when the Bt exceeds 10nT. Strong values start at 20nT and we speak of a very strong total interplanetary magnetic field when values exceed 30nT. The units are in nano-Tesla (nT).
Polarity of IMF
The Phi angle is the angle of the interplanetary magnetic field that is being carried out by the solar wind. In the first graph the orange line Bz shows the polarity. When we see the Phi angle go southward (into the negative) This shows the increase of the transport of solar winds & mass into the Earth’s magnetosphere. When it goes into the positive, this shows a decrease in the transport of solar winds and mass into Earth’s magnetosphere. A better representation of this can be seen in the Phi GSM graph (second graph) as the dotted lines goes up and down (or in the towards and away region)
Density
The third graph shows the density of the solar winds, measured in particles per cubic cm. Normally a number 10 or higher is ideal but this doesn’t have to be very accurate.
Speed
The fourth graph shows the speed of the solar winds, measured in km/s. It varies from 300km/s to 1000km/s, a higher number means a stronger impact but geomagnetic storms can appear at lower speeds as well
Weather
The weather should be clear with no clouds present and no moon is ideal. Also, the light pollution affects the chances so the less it is the better.
Implementation
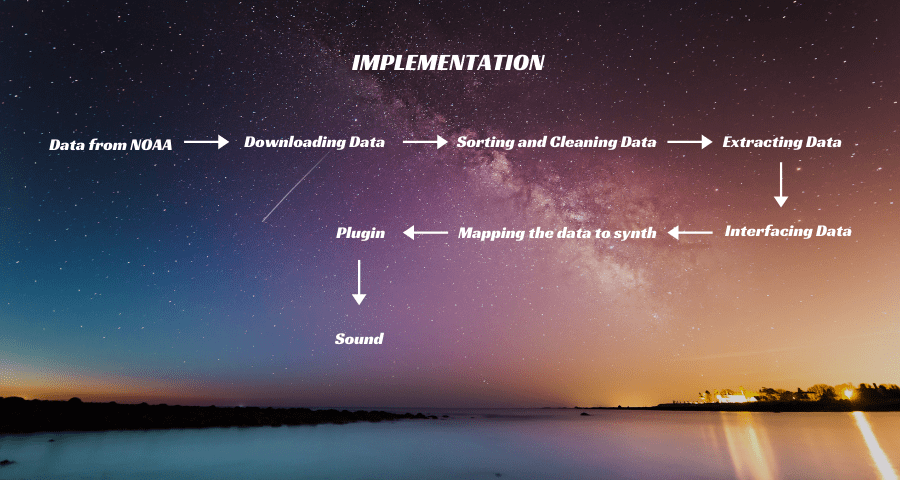
The project follows a relatively simple structure of implementation, which is as follows:
- Download data from the web link
- Sorting and cleaning data acquired.
- Extracting the data and sending it to csound via python.
- Mapping the data to parameters in the synth and effects
- exporting it to a functional plugin

The system
The project was an ambitious one and we decided to divide the system and work on the components individually. Joel worked on download script and Synthesizer, Lindsay worked on Data sorting and Csv generation and Abhishek worked on Python - Csound interfacing and data extraction. All these components are briefly explained below:
Data Download
The data is downloaded by Python using the Selenium module. The text file is generated on the NOAA page using Javascript, so we needed to create a web crawler that hosts an instance of Firefox and navigate to the correct element of the web page to download the file. Because of this the downloading of data is relatively slow and the construction of the site makes the downloading unstable. This is a point of improvement in the project, to have a data source or a way of acquiring data that is faster and more stable. This would make it possible to play on constantly updated data, which unfortunately is not possible at the moment.
Data Sorting and csv file
The downloaded file is a text file so we remove the extra lines we don’t need, and some errors in data. After this we convert the text file into a csv file for easy handling of data in python. Once the csv file is generated, data is extracted from it by using pandas dataframe.
Communication between python and csound via osc
Communication between csound and python is done using Open Sound Control - OSC. By hosting an OSC server python can receive messages from csound “asking” for a specific time. This message is interpreted as an index which is used to select the appropriate set of data, which is then sent back to csound. To run the vst the python script has to be running independently listening for messages and responding back with data.
Sound synthesis in csound
The sound is generated in csound using two sound generators: granular synthesis of sinus waves and filtered noise. These two sounds are mixed together and pass through multiple effects before output to the DAW. By using granular synthesis as the main sound generation we are offered a lot of flexibility in characteristics of the sound. The different parameters that control the sound are mapped to different parts of the data in a way that reflects how the aurora is affected by the same data. A low chance of aurora is reflected in a dull sound without much motion, and as individual grains are masked the synth seems to struggle just as the magnetic storm is struggling to penetrate the magnetosphere. Similarly when the speed of the solar wind is high the sound and movement of the generated noise is increased, as you would expect the sound of wind on earth.
Mapping of variables to sound
The data set consists of measurements every 5 minutes for seven days. For every variable and measurement we get three variables of the maximum, the minimum and the medium measurement for that variable that 5 minutes period. For instance Bt (strength of the magnetic field in the solar wind), on March 20:th 2021 at 01:00 am the medium, minimum and maximum are respectively: 15.99, 15.88 and 16.03 nT. By mapping these three different values and/or the difference between them we interpret the connection between data and the aurora to create a sound that represents the conditions for aurora. Here follows a brief presentation how different parameters of the sound are affected by values of the data. All values are scaled and transformed into ranges that make sense for each application. The details of the scaling are not discussed here, but can be viewed in the code placed on github.
Parameters
-
Relative duration of grains: Base duration is controlled by medium density. This is modulated by an oscillator where the speed and the amplitude is controlled maximum and minimum density.
-
Random masking of grains, and grain envelope: Both are controlled by medium Bz.
-
Noise generation and filtering: Medium speed controls the amount of noise in the mix. The noise is filtered by 8 band pass filters where the steepness of the filter is controlled by the minimum speed, and modulated by an oscillator with a speed determined by the difference between maximum and minimum speed. The frequency of the lowers filter is one octave below the played note, and the following filters are placed harmonically brighter. The brighter filters have a lower volume by a factor controlled by the maximum speed.
-
Chorus: The volume of the chorus is determined by maximum Bt. The minimum delay time and the rate of change is controlled by the medium Bt. The amount of modulation is controlled by the minimum and medium Bt.
-
ADSR: All the components of the ADSR-envelope are controlled by both the medium density and medium Bt.
-
Phaser: The volume of the phaser is controlled by the maximum Bz. The speed and direction is determined by medium Bz and the sharpness of the filter is controlled by minimum Bz.
-
Reverb:The volume of the reverb is controlled by maximum Bt. The cutoff frequency is controlled by the minimum Bt and the medium Bt controls the length of the reverb.
Demonstration
Endnotes and Future Developments
In this quest of chasing the aurora in the given timeframe, we are happy and feel satisfied with the result we have achieved. Even so, we all agree that the synth can be improved a lot in different aspects.
-
Make a one packaged program: We would be working on the project, trying to make it more stable and possibly make it a one package deal, in which users don’t have to run python separately, just running the vst plugin does the job.
-
A sound installation: One other cool future aspect of this project could be implementing it as a sound installation where the synth receives high resolution data in real time and plays the music accordingly.
-
An interactive webpage: A dynamic web page where users can interact with the sound without thinking about the nuances of DAW and plugin is another area where the project can be expanded.
The code and files can be accessed via github repository here
Useful links
Real time solar wind data: https://www.swpc.noaa.gov/products/real-time-solar-wind
Space weather data: https://www.swpc.noaa.gov/communities/space-weather-enthusiasts
Aurora information: https://en.wikipedia.org/wiki/Aurora https://site.uit.no/spaceweather/what-are-the-northern-lights-aurora/ https://www.space.com/15139-northern-lights-auroras-earth-facts-sdcmp.html https://www.nasa.gov/mission_pages/sunearth/aurora-news-stories/index.html https://www.swpc.noaa.gov/ https://www.theaurorazone.com/about-the-aurora/aurora-legends
