Portal Flowchart
Week 41 in the portal, Group C
Flowcharts
A rigid signal flowchart is an absolute must in any complex system. These charts help systemize, organize and streamline our interactions with the system. Ideally, a detailed flowchart will helps us save time setting up before class and enable more students to orient, use and explore the portal features. Because of our endless adjustments, 5-minute fixes, and general non-sense that drove Iggy to push a preparedness test upon us, we decided it was about time for an up-to-date flow chart to help us on the way to portal stardom. Or at least a setup that we can turn on and start class with.
The MCT portal chart
In our quest for the perfect chart, we agreed that detailed connection specifications and a good design is key. Therefore, we decided to center the flowchart around the Midas mixer and LoLa PC, since these two machines serve as the central hub of our system. While this chart is specific for the UiO setup here, there are minor differences on the Trondhiem side and perhaps they would be able to make a chart using this template.
Following Anders Tveit’s recommendation, we used Lucidchart, an application which allows people to collaborate on building flowcharts online. After making a draft, Paul Koening printed out the chart and took it to class. This way, we could inspect and explore the portal first hand while writing down the connection specifications. This process led to further dialog and more discoveries which in turn led to editing, and finally the final chart seen below.
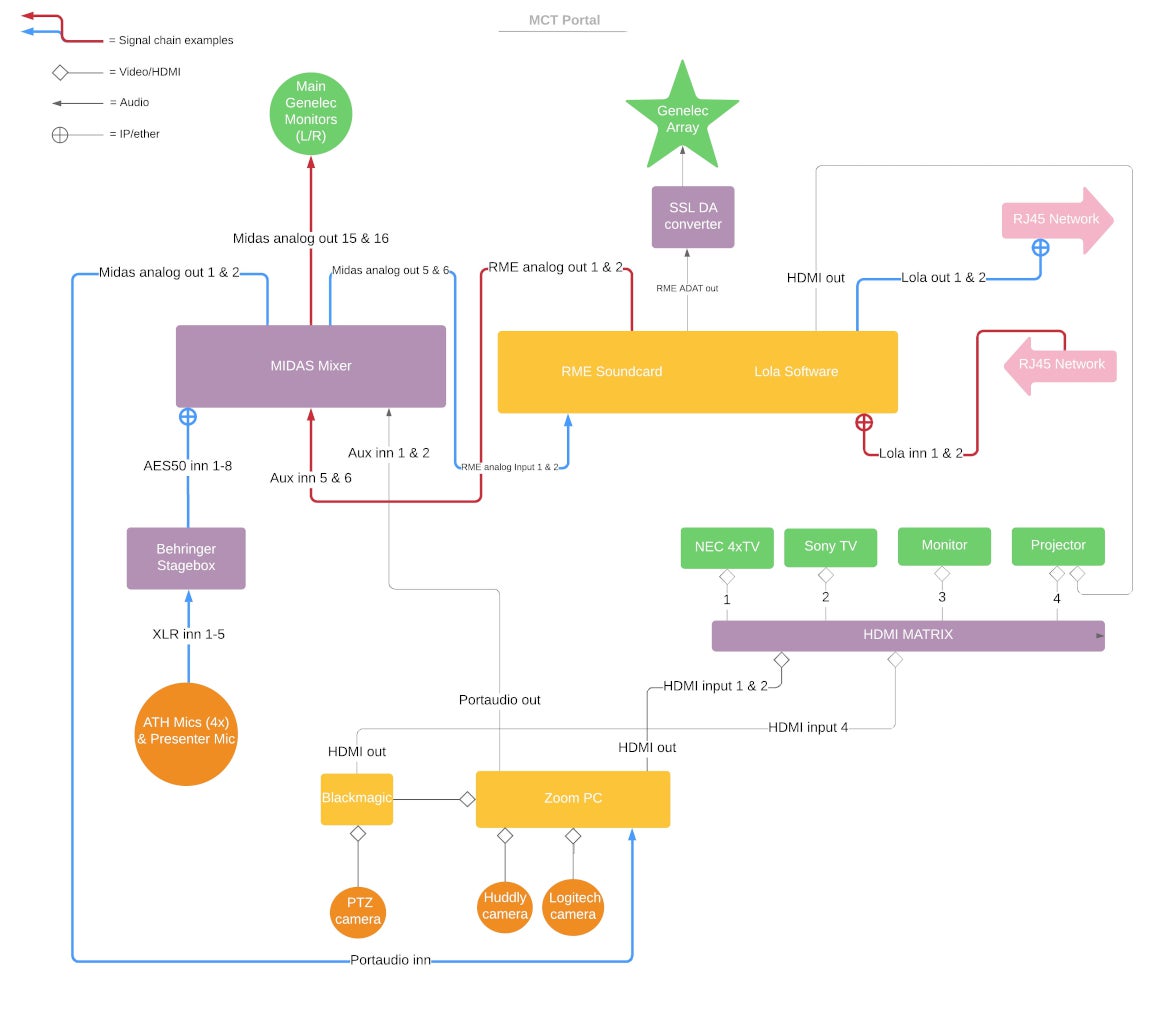
All the objects in the chart have inputs on the bottom and and outputs on the top. The philosophy behind the object coloring is fairly arbitrary but it tries to discriminate between more “active” machines (yellow), “passive” machines (purple), output oriented machines (green), input oriented machines (orange) and finally ports between campuses (pink).
The connection wires’ shape and color also have meaning. The shape determines what type of signal passes through the wire, and the different colors indicate some signal chain examples, for instance the red path which illustrates the route audio takes from Trondheim to our Oslo ears. All of this information can be found in the legend.
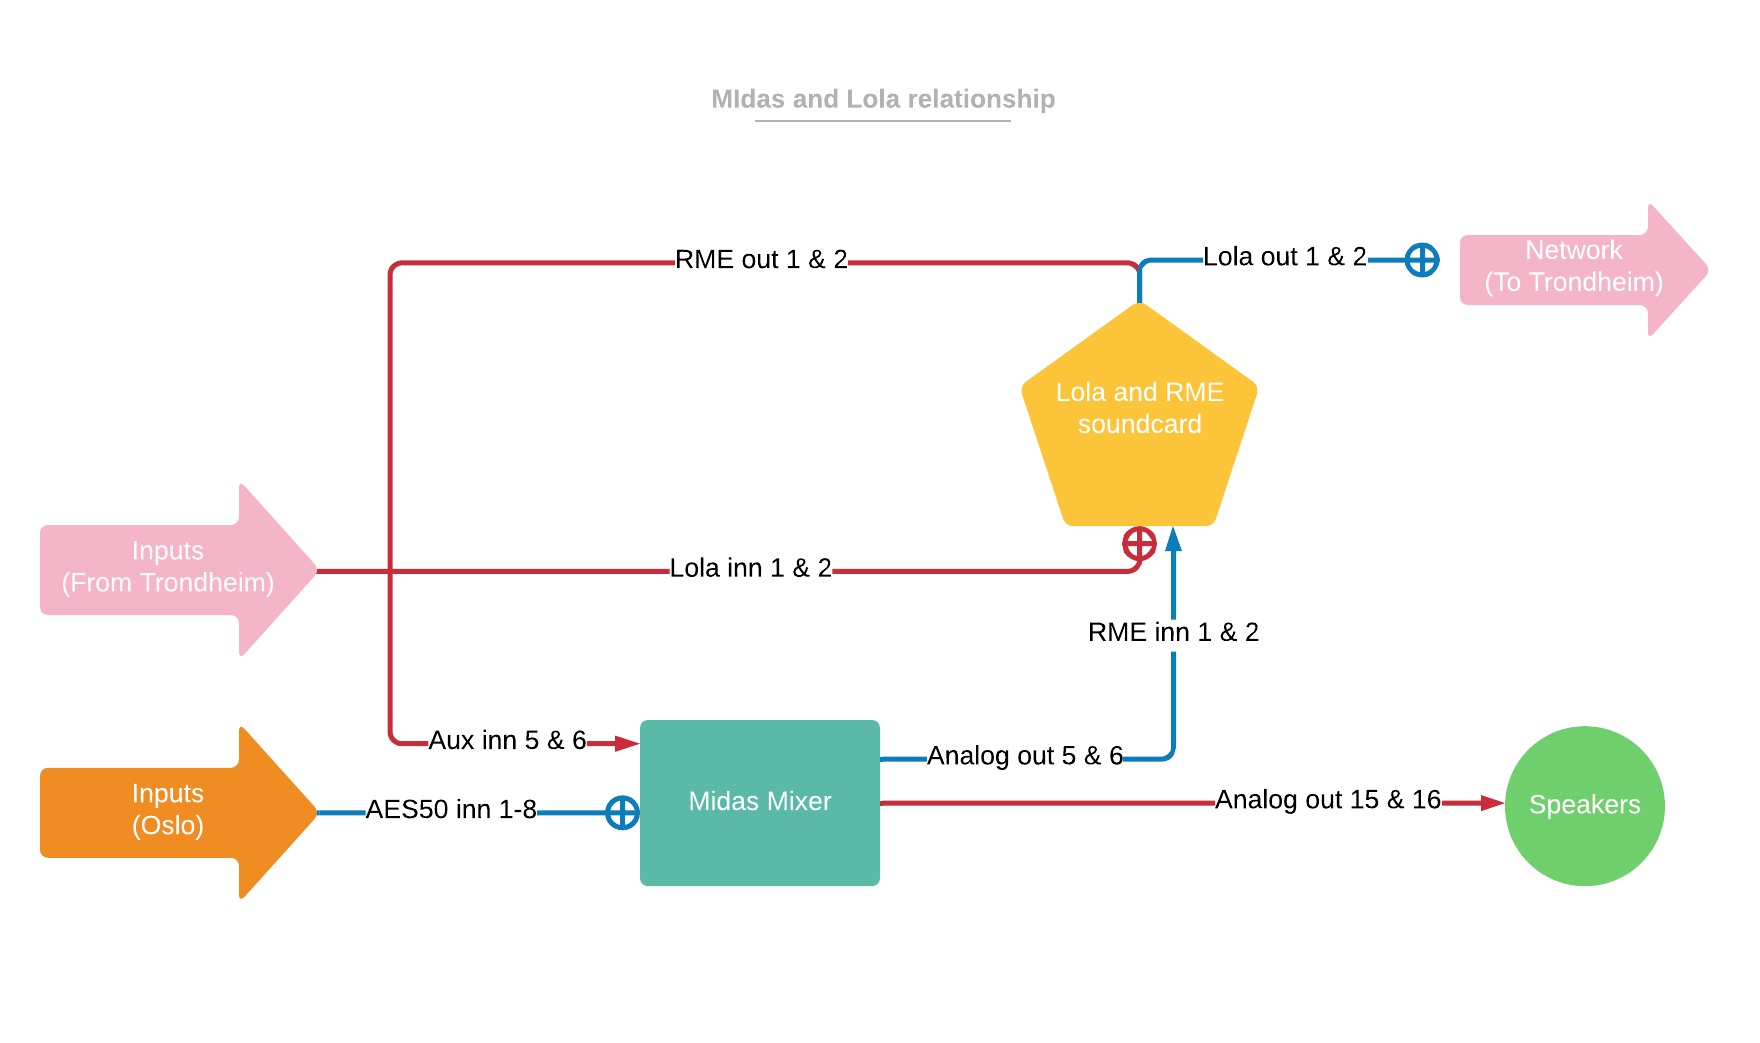
LoLa and Midas chart
The routing and interplay between the LoLa PC (with RME soundcard) and Midas mixer is often a source of trouble in our portal. Therefore, we felt it necessary to take extra measures to highlight this relationship. This second flowchart (below) follows the same principles as the one above, with the exception of having object inputs and outputs on the sides as well on the top and bottom.
Eventually, (we hope and pray) we might have a system that begins with an overhead mic directly to LoLa or Zoom, and use a breakout cable to pass Oslo inputs through the Midas mixer when we need it. Having a well-functioning setup with as few wires, sliders, or settings to configure is the current dream for Gaute at least.
Summary
We hope that these flowcharts can be used as manuals for setting up a default MCT portal rig, troubleshooting, as well as serve other educational purposes in our cross campus classroom. We also hope that our charts can help future MCT students become comfortable with the portal and inspire them to update the system in various ways.
Copy our charts, both the Portal chart and the LoLa and Midas chart.