Breathing through Max
Rationale
Analyzing motion from smartphone sensors or laptop cameras is a both a challenging scenario and exciting opportunity. This project transforms the live acceleration data recorded from an iPhone resting on the torso of a person laying down into a dynamic sonic atmosphere that may enhance the monitoring one’s breath through auditory cues. One potential use of this system would be as a meditation or relaxation assistant. The sound environment aims to be soothing and ought to coax one into a deeper and more rhythmic breathing cycle. There is ample empirical data to suggest that paced respiration can reduce anxiety and other measures of perceived stress. Following common themes of this literature, biofeedback is a topic of importance in recognizing the effects of this system on a user.
The inhales and exhales are identified as peaks and troughs within the accelerometer data and as a result, an average breathing rate can be obtained that serves as a marker of how consistently rhythmic the individual’s breathing rate is. This indicator is used to grow and shrink the sonic environment as one’s breathing and body begin to settle. On the surface, the information gained from the chest’s rise and fall appear to be an easy to manipulate stream. However, most of the time spent on the project involved developing a reliable and flexible model for processing a very noisy stream of data due to the micro-movements that were being recorded. Various parameters of the system were then modulated by other much more noisy sensor data as well.
Methodology
The first task before embarking on this project was finding a suitable app that would be a reliable recorder and streaming platform for micro-motion data. Sadly, there are not many apps that provide a data logging functionality on iOS and even fewer that provide a way to record data from the sensors and only one that appears to meet the requirements I had for such an app,
- Log data at a high frequency (> 50hz)
- Record multiple sensors at once
- Export this data in CSV format and
- Send this data over a networked connection
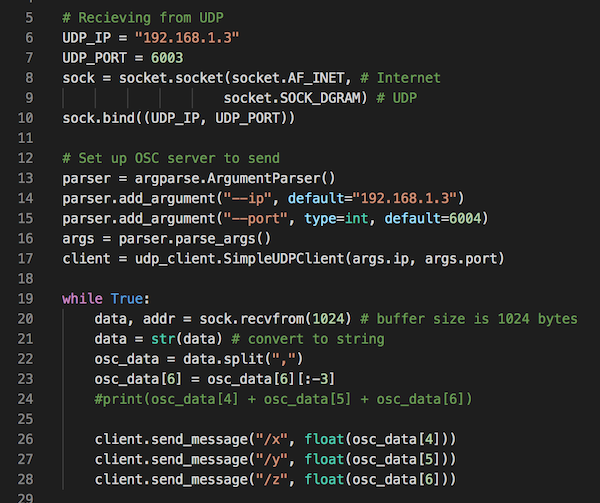
Most of these apps transmit their sensor data over a UDP connection using the OSC protocol. This type of communication is well supported by many DAWs and platforms like Max and Pure Data. However, the app that was used, SensorLog unfortunately, did not send data with the OSC protocol. Instead, it sends the data over UDP as it would when writing a CSV file that was not compatible with Max’s [udpreceive] object.
To work around this, I wrote a python script that acted as a node to receive, format the stream into proper OSC messages, and finally, send the data locally to a specified port within Max. The script operated by receiving a row of data, splitting the list of data points into an array, and then sending each index of the array as a pair with a specified OSC message. I used the messages “/x”, “/y”, and “/z” as shorthand for the x, y, z, acceleration data. Once this was passed into Max, the data was able to be handled the same way as any other OSC message.
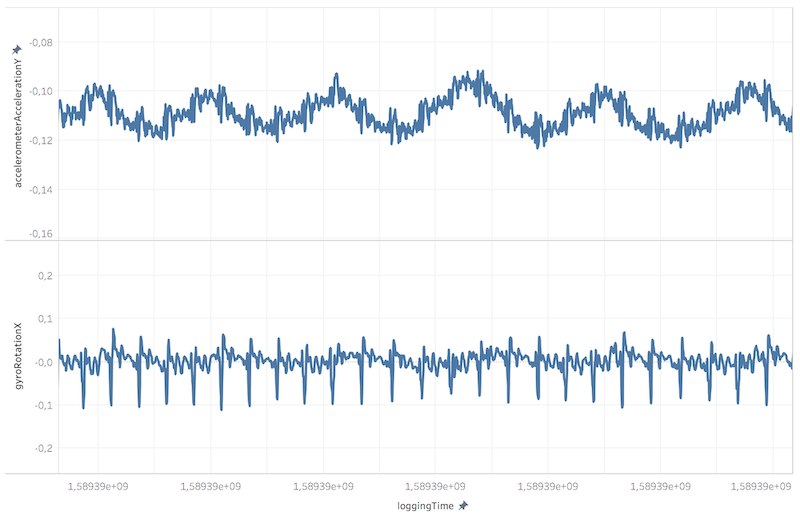
After some initial testing of various sensors and positions during recording, I found that the acceleration value for the y-axis was the most reliable source of information for tracking respiratory motion. Because of the placement of the phone, none of the other sensors render any useful information. The only other sensor that appeared to follow the same information was the gyroscope, but the sensor upon inspection looked like a transformation of the acceleration data. In the first trial recording set of breathing, I was able to find that this sensor’s y-axis extracted recognizable oscillations of the rise and fall of my stomach. However, because the movements were quite small, the noise of the sensor clouded what was, in reality, a smooth envelope of motion.
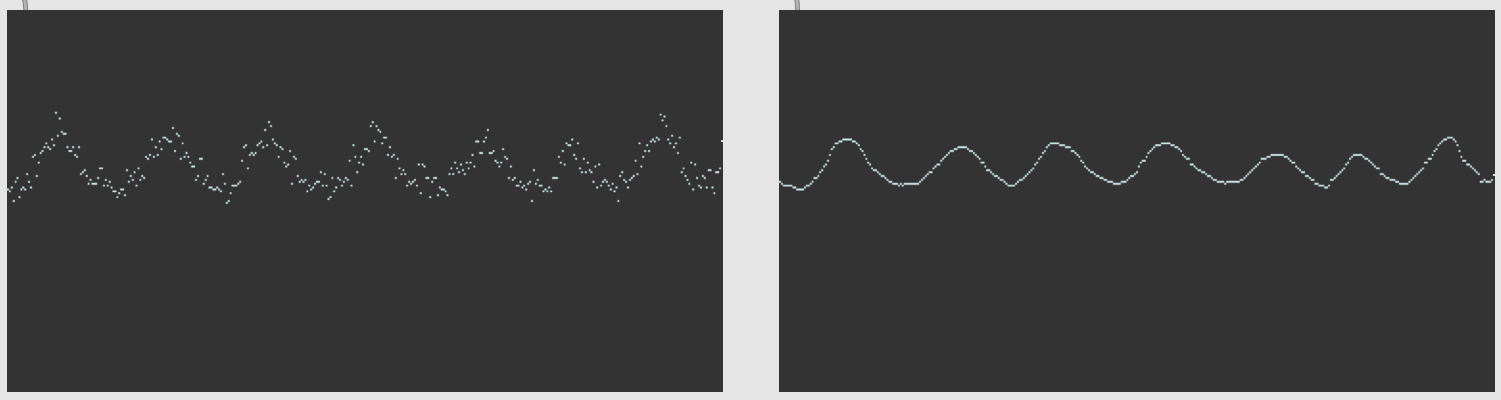
Reading the CSV data into Max was achieved by loading each line of the CSV as a text file from which I could use a [metro] object to iterate through the [coll] dictionary that stored the sensor data (I stole this bit of Max data). From Max, I could visualize the data stream easily using a [multislider] window. I then set out to smooth this data through a variety of techniques. I found that a reliable method of smoothing the noisy data was to create a buffer of the last x number of samples (with [zl.stream]) and then output the mean ([mean]) of that sliding window. The larger the number of samples, the smoother the data, yet this stunts some of the local dynamics within the stream and creates latency. After exploring further I found a 3rd party object [dot.denoise.sliding] that includes better logic for excluding outliers within streams.
This returns to an observation I noticed when looking at sensor data. I noticed that one of the gyroscope sensors also was repeating in a rhythmic pattern, but much faster and pronounced than breathing should be. I realized that these were pronounced fulgurations of my heartbeat and that these impulses were actually affecting the accelerometer sensor data I was analyzing from the y-axis.
Once the oscillations were smoothed, the next step was identifying local minimums and maximums of each breath. Again, the dot library had a nifty object to find local max/mins by checking for changes in sign (+/-) from a previous data point to the next. This would have worked nicely if the data rose and fell with continuity. But due to the noise, there were a number of places near the peak or trough of the oscillations where even a smoothed data point might change the sign of the differences between the current and previous point.
I tried number of techniques to suppress the improper max/mins that would appear such as forcing a minimum delay to check for a max after finding a min or max, as well as attempting to doubly embed local max/min detection. The most successful and flexible method by far was setting a minimum distance between the breaths that were taken. This is a reliable method as a single breath could vary in speed and the expansion of the torso would be the same.
I further enhanced this solution by making the distance dynamically shifted by an average of the distance between the last 5 max and mins.
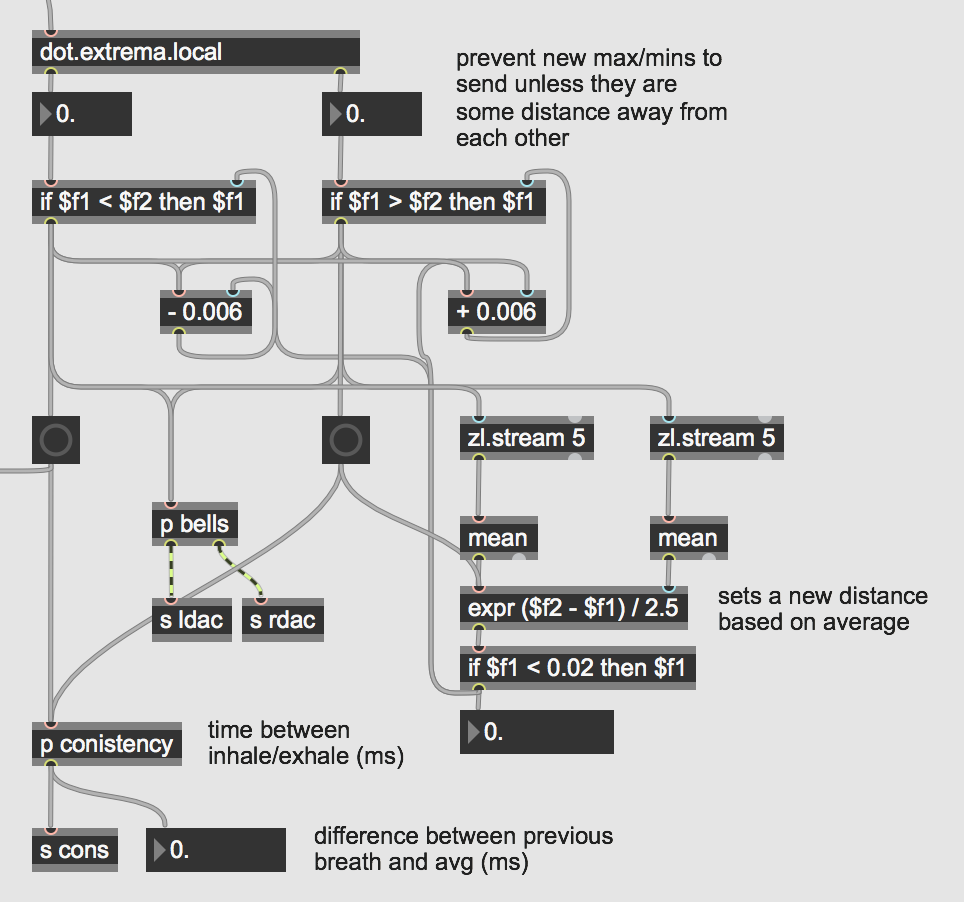
Finally, the last piece of data that is inferred from identifying the local max/mins of each breath is the average time between each inhale and exhale. This is calculated as a metric of respiratory rate consistency which is the difference between the last period between a max/min and the average of these last 10 periods. This value is then scaled and used to attenuate a sound clip of wind chimes that enter when the consistency value is low. Thus, the wind chimes should emerge as a result of a restful cycle of breath and provide positive feedback to the user. In addition to the wind chime samples, there is a three-oscillator drone instrument was driven by the noisy data from the x and z-axis accelerometer streams. This drone adds a subtle resonance to the bells and provides some ambient feedback of the motion of the breath. This is achieved by scaling the smoothed acceleration data from the y-axis and modulating the amplitude.
Results and Conclusions
After debugging the system for quite some time, I may not be able to provide the best perspective on how useful it is for its intended purpose. Even still, the system may allow a user to pay attention to their biorhythms and less to other distracting thoughts that might interrupt a session. Most of the time spent building the system was in an effort to fine-tune the analysis of these data streams in real-time so many of the acoustic elements were secondary to this objective. The streams were processed flexibly and reliably for the dynamic stream and I’m quite happy with the way the data is handled throughout the system – even in extreme cases such as erratic motion where the amplitude of all sounds is reduced to silence. From this perspective, I find the system quite usable but I am not entirely pleased with the sound of the instruments and sonic environments.
There are still some unanswered questions I have about more technical aspects of the system. The first being the latency contributed form formatting UDP messages in a Python node and then passing it on to Max. I was fine with this compromise considering the app’s considerable logging speed (100Hz) which enabled much of the noise to be averaged. Another question is one of compatibility: If I were to use another sensor app that was able to directly send OSC data, perhaps at a lower logging rate, would this dramatically affect the system’s ability to identify peaks and troughs? For future work, the system’s reception logic should allow general purpose OSC enabled apps to connect to the system in addition to SensorLog for better compatibility.
You can find the code here along with a setup.