Using Features of Groove in Music Recommendation Systems
Abstract
Music streaming services rely on music recommendation systems (MRSs) to keep users engaged and shape their musical taste. These systems rely on a combination of user and item modeling, and are adept at serving relevant recommendations to users through the analysis of collected data. Streaming services must now focus on combating user feelings of stagnation and listening fatigue associated with not receiving exciting and unique recommendations. This thesis proposes that incorporating elements of groove into a music recommendation system’s features can produce higher quality and more surprising recommendations by being genre agnostic while still recommending tracks based on one of the most important characteristics of music. To accomplish this, a beat tracking and onset detection system was used to analyze two varieties of percussive source separated audio to quantify features of groove. These features were then used to sort items into clusters, which were tested in evaluation sessions to determine if groove could influence quality or expectedness of recommendations. While the clusters had little effect on quality of recommendations, participants were consistently reporting items as unexpected and high quality, showing that recommending items based on features of groove could be useful in producing more serendipitous recommendations.
Design and Implementation
Extracting Groove Features
The audio files used in this project were taken from the Free Music Archive (FMA). Spleeter and Librosa’s HPSS function were used to isolate the percussive elements in each musical item. These two methods were chosen after testing the onset and beat detection system using test audio files (view code and results on GitHub). Librosa was also used for its beat tracking and onset detection functions, which were run on each audio file in the fma_small dataset from the FMA. Using the beats and onsets, the features of groove known as pulse, subdivisions, and syncopation were calculated to be used in the simulated MRS.
According to Câmara and Danielsen, the pulse of the groove is defined as the steady beat that keeps the groove going, acting as the foundation to add other groove characteristics on top of, the subdivisions of a beat are defined as the notes played at faster metrical levels than the beat, which are generally considered necessary to establish a groove and give a sense of drive to the groove, and syncopation enhances a groove by temporarily displacing the normal accent of the meter, and is considered to be the most important element in defining a style of groove.
Each beat for all musical items in this project is defined in a 12-unit timespan, which allows groupings based on three, four, and six units. The table belowshows the different rhythms that were analyzed for each item and which unit the onset needs to fall on in order to be on-beat for that specific rhythm, which is represented by an x.
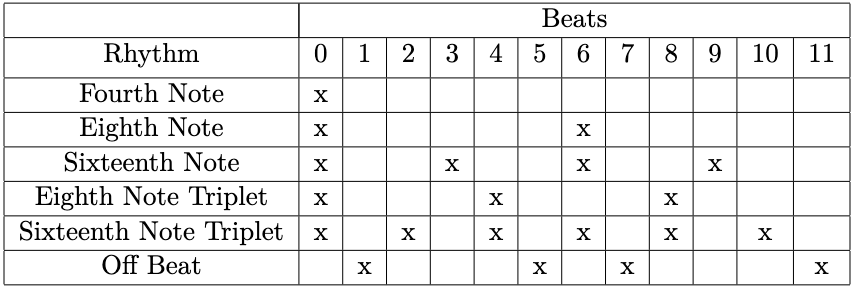
The fourth note rhythm can be considered the pulse of the beat, while all other unit divisions besides those marked “off beat” are the subdivisions. After all the onset beat bin totals were found, the number of times an onset appears in an on-beat bin for each rhythm is divided by the total number of onsets found for all beat bins to normalize their values. These values numerically represent the likelihood of an onset in a rhythm being played across all onsets in the song segment. These normalized values are then used as features in the ML system.
Syncopation is measured in two ways. First, the “off beat” bins are normalized in the same way as the pulse and subdivision rhythms. Second, the weighted note-to-beat distance (WNBD) is calculated. To find the WNBD of a note, the T(x) value, which equals the minimum distance between the note and the previous or next pulse as a fraction, must first be defined. If the beat occurs on a pulse, the WNBD is 0. If not, the WNBD value is then defined in relation to the end of the beat, which is considered to be the start of the next beat. If the beat ends before the next pulse, on the next pulse, or any time after the next two pulses, WNBD = 1 / T(x). If the beat ends between after the next pulse, but before or on the pulse after the next pulse, WNBD = 2 / T(x).
Clustering Musical Items
The k-means clustering algorithm is a popular option for solving clustering problems due to its relative ease of implementation and its computational efficiency. A k-means clustering algorithm was created in order to cluster items together based upon similar groove features using both Librosa and Spleeter PSS detected beats and onsets. The number of clusters were determined through manual analysis using the elbow and silhouette methods, as well as analyzing the resulting sizes of the clusters to make sure they were relatively even. To determine the cluster validity, the six most central tracks of each cluster were examined in a cluster tendency analysis in order to determine if the percussive elements have groove characteristics in common
Evaluation Session
The evaluation session consists of a participant listening to multiple 30 second segments of songs (download on GitHub). Each of these items are one of the six closest items to the centroids of either a Librosa PSS cluster or a Spleeter PSS cluster, since these can be considered the most representative items of each cluster. The participants then rank these musical items on two different seven point Likert scales. The first scale determines the participant’s subjective enjoyment of the track, with 1 corresponding to “extreme dislike” and 7 corresponding to “extreme like.” The second scale determines how likely the participant would be to listen to the track, or in other words how expected the item was, with one corresponding to “extremely unlikely” and seven corresponding to “extremely likely.”
Results and Discussion
Quality and Expectedness Results
The standard deviation and average values of the quality of all items in each Librosa and Spleeter PSS cluster can be viewed below.


The standard deviation and average values of the expectedness of all items in each Librosa and Spleeter PSS cluster can be viewed below.
Assuming a normal distribution for quality and expectedness ratings, the average quality and expectedness values across all tracks for both PSS methods should be around 4. Across all participant ratings for all items of the evaluation session, an average quality rating of 4.25 in the Librosa segment suggests a fairly normal distribution, while an average quality rating of 3.52 suggests that other factors were at play that pushed the average rating further from 4. This could be because there were not enough ratings for a normal distribution, due to only having 5 Spleeter PSS clusters with 540 total ratings compared to 6 Librosa PSS clusters with 648 total ratings. Another explanation for this discrepancy is that the overall quality of the items served in the Spleeter system may have been less desirable than the items served by the Librosa system, which will be discussed further while analyzing true positives and true negatives later in this section.
In terms of the average expectedness, both Librosa and Spleeter PSS clusters have lower than average values, with the Librosa method’s average value being 3.37 and the Spleeter method’s average value being 2.91. This is mostly likely on account of the content of the FMA, which includes more experimental and left field musical items than streaming services. While streaming services contain plenty of experimental music themselves, it also contains nearly the entire history of popular music, which could result in a more normal distribution of expectedness. With lower than average expectedness values, it is also expected that there will be more serendipity and true negatives found compared to anti-serendipity and true positives, respectively.
Standard deviation of quality values per cluster is analyzed to determine if solely using features of groove in an MRSs can serve relevant recommendations to users. Assuming a normal distribution for quality and expectedness ratings, around 68% of the ratings are within one standard deviation of the mean and 95% of the ratings are with two standard deviations of the mean. Therefore, if the average standard deviation across all clusters is below 1.5 then it can be reasonably assumed that the recommendation system is better than random guessing.
With an average quality rating standard deviation per cluster of 1.42 for Librosa PSS clusters and 1.54 for Spleeter PSS clusters, it can be concluded that participants were more likely to receive relevant recommendations using the Librosa method, but both methods were fairly close to random guessing. Therefore, for the goal of suggesting high quality items to users, using only features of groove does not produce relevant results. However, the slightly lower standard deviation per cluster average that the Librosa method produces suggests that with further fine tuning and possibly more features, a more refined recommendation system could be developed. It is also worth noting that the average standard deviation of expectedness ratings per cluster for both Librosa and Spleeter methods are fairly similar and above 1.5, suggesting a truly random distribution of expectedness values per cluster.
Serendipity and Anti-Serendipity Per Cluster
The charts showing serendipity and anti-serendipity per cluster for both the Librosa and Spleeter methods can be viewed below.
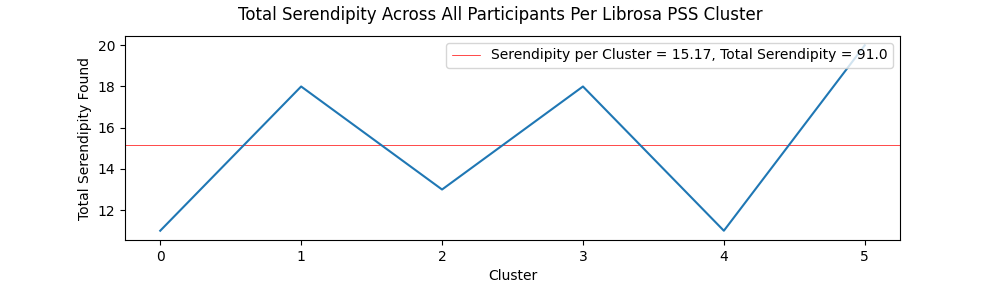
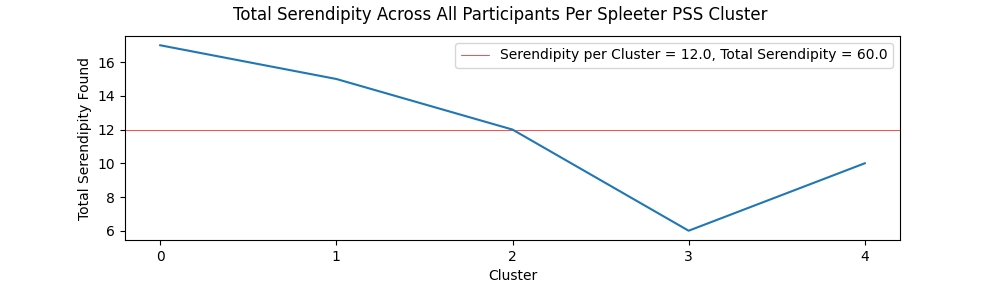
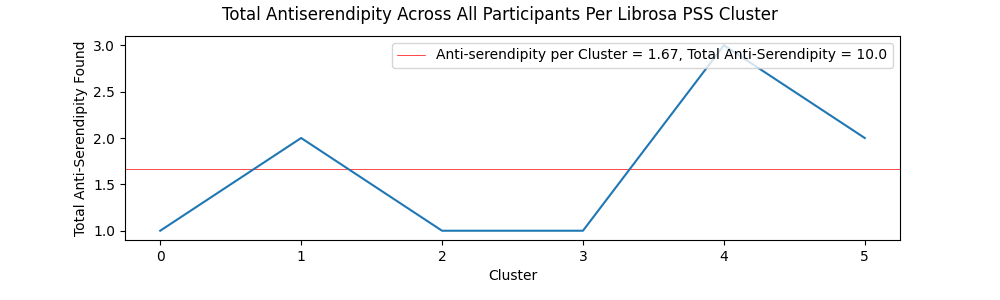
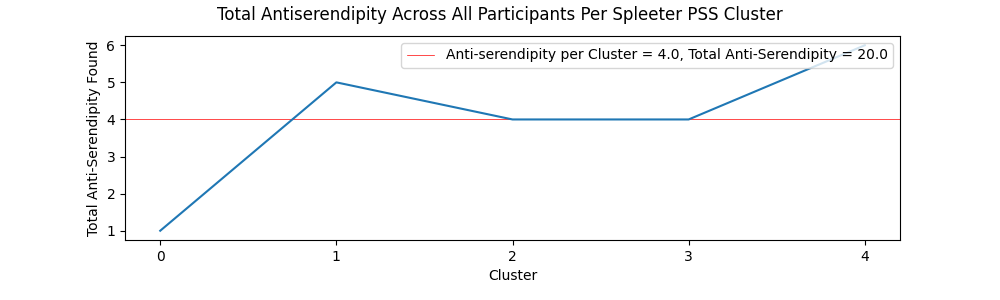
Participants reported higher than expected accounts of serendipity, with both Spleeter and Librosa PSS items having higher than 10% serendipity accounts. This could be attributed to the diverse catalog of the FMA, or a general tendency for users to encounter positive surprises when exploring a wide variety of music. However, participants tended not to report instances of anti-serendipity. This could be a result of the combination of lower than average expectedness values for both Librosa and Spleeter PSS clusters and the aforementioned accounts of the low quality of some items in the FMA. The perceived low quality may have resulted in lower rated items receiving equally low expectedness values due to the intensely negative reaction they elicited in some participants. However, since items near the centroid of Spleeter PSS clusters produced more than double the instances of anti-serendipity compared to Librosa PSS clusters, it can be stated that Librosa PSS clusters do a better job at combating stagnation and steering users away from low quality items in genres they are familiar with. Overall, the high values of serendipitous items versus the much lower values of anti-serendipitous items shows that if music streaming services expanded their horizons by introducing new styles of music to listeners that do not have a history listening to that style of music, they would be much more likely to find positive surprises rather than negative surprises, and that achieving serendipity through the lens of groove could be a worthwhile approach to address this issue.
True Positive and True Negative Per Cluster
The charts showing serendipity and anti-serendipity per cluster for both the Librosa and Spleeter methods can be viewed below.
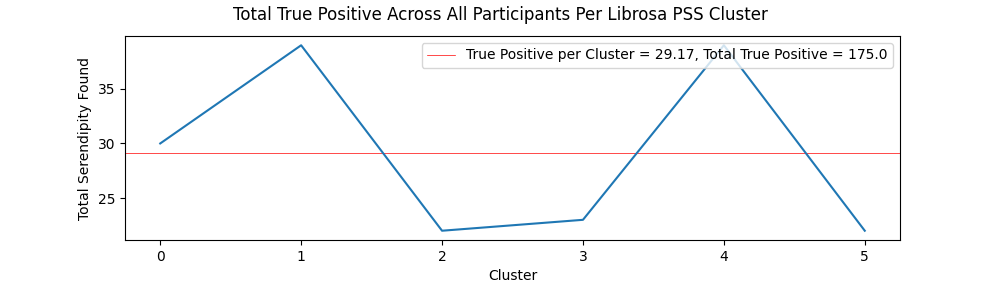
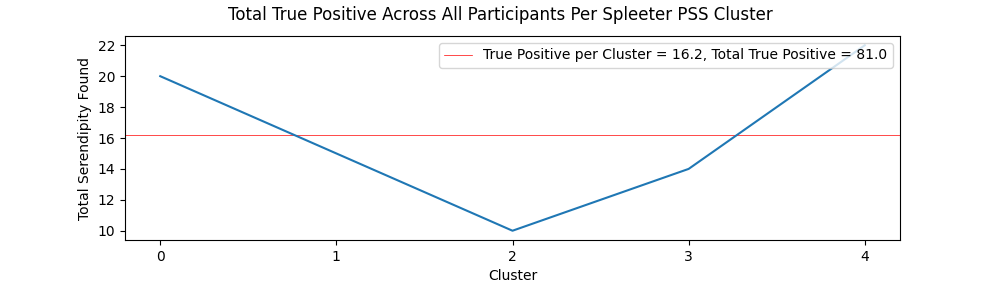
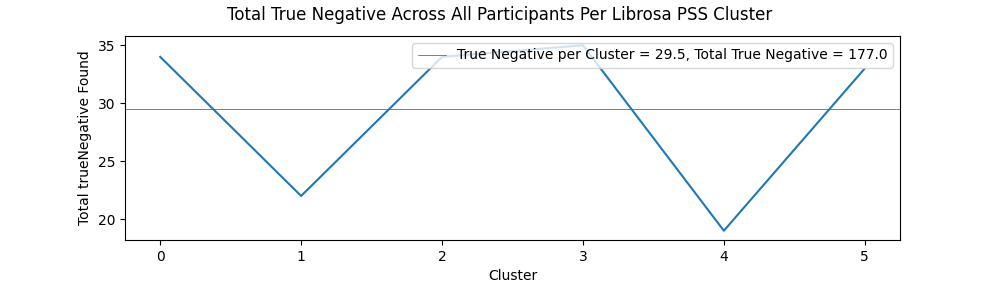
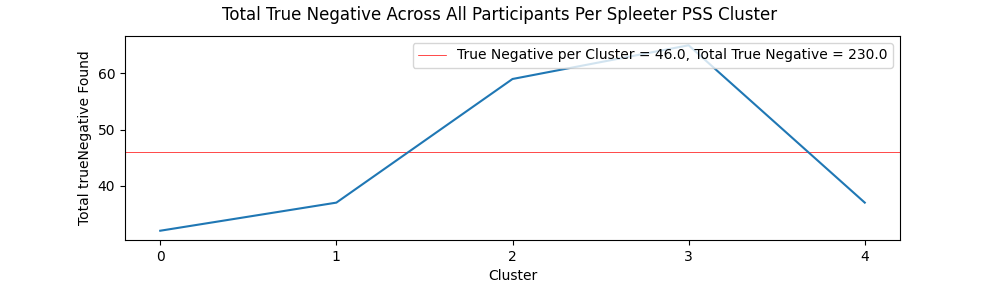
Tracks from the Librosa PSS clusters contained a fairly even amount of true positive ratings (27.01% of all ratings) and true negative ratings (27.31% of all ratings), further suggesting a fairly even set of musical items in terms of quality and expectedness for each participant. Comparatively, items from the Spleeter segment of the evaluation session contained a significant number of true negatives (42.59% of all ratings), compared to only 15% of all ratings being marked as true positives. This is backed up anecdotally by some users pointing out the the end of the test, when the items from the Spleeter clusters were played, contained more strange and experimental music.
Effects of Serendipity and Anti-Serendipity On Average Cluster Quality and Expectedness
To begin the discussion of the effects of serendipity and anti-serendipity on average cluster quality and expectedness, it is worth noting that the number of clusters containing anti-serendipity were miniscule and therefore did not produce statistically significant results. However, there were many instances of serendipity across both Spleeter and Librosa PSS clusters, which gives a better insight into how serendipity affects quality and expectedness values. In general, Librosa PSS clusters had a much better spread of clusters that contained serendipitous items than Spleeter PSS clusters. However, both Librosa and Spleeter PSS clusters that contained accounts of serendipity only had higher than average quality values a little over half of the time. While this suggests at least a little correlation between accounts of serendipity and an increase in quality, this could also be explained by the fact that an account of serendipity guarantees that at least one item in the cluster was rated above a 4 for quality. This could be all that a cluster needs to boost its average above what was typical for a user, so it can be stated that correlation between serendipity and quality was not significant for either PSS method. Similarly, average expectedness in Spleeter PSS clusters with accounts of serendipity was below average a little over half of the time, suggesting low correlation. However, a significant number of Librosa PSS clusters with accounts of serendipity had below average expectedness values, with 66.13% of the clusters having below average expectedness values. Therefore, the most significant finding in this analysis is that for the Librosa PSS clusters, a cluster that contains an instance of serendipity has some correlation with a lower expectedness value across all items in the cluster.
Conclusion
Using Librosa HPSS was found to be superior to using Spleeter in nearly all scenarios, including finding beats and onsets, analyzing groove, and clustering items with similar grooves together. Even though recommending musical items solely based on groove will not produce higher quality recommendations for the average streaming service user using either PSS method, the findings in this study could be used to fuel future research on this topic. Combining features of groove into other state-of-the-art MRSs could help fight feelings of stagnation by helping to recommend music outside a streaming service user’s typical consumption. Future studies should focus on building a more robust beat tracking system, testing different styles of HPSS, combining groove features with other MRS features, using different music archives, and expanding the scope of evaluation sessions with more participants, musical items, and a better system for evaluation sessions.
Sources & Resources
- All code and results on GitHub: https://github.com/jpclemente97/mctThesis
- Thumbnail: https://www.vecteezy.com/vector-art/210521-party-people-dancing
- G. S. Câmara and A. Danielsen, “Groove,” in The Oxford Handbook of Critical Concepts in Music Theory, A. Rehding and S. Rings, Eds., Oxford University Press, 2020, pp. 270–294. doi: 10.1093/oxfordhb/9780190454746.013.17.
- L. A. C A and A. C A, “Research on DNN Methods in Music Source Separation Tools with emphasis to Spleeter,” Int. Res. J. Adv. Sci. Hub, vol. 3, no. Special Issue 6S, pp. 24–28, Jun. 2021, doi: 10.47392/irjash.2021.160.
- M. Defferrard, K. Benzi, P. Vandergheynst, and X. Bresson, “FMA: A Dataset For Music Analysis.” arXiv, Sep. 05, 2017. Accessed: Sep. 23, 2023. [Online]. Available: http://arxiv.org/abs/1612.01840
- F. Gomez, A. Melvin, D. Rappaport, and G. T. Toussaint, “Mathematical Measures of Syncopation”.