Visualizing Psyhophysiological Responses to Music Stimuli

Visualizing Psychophysiological Responses to Music Stimuli
The world is going through a global mental health crisis, although the traditional pharmaceutical drugs available can be effective and are an important support for people with mental disorders, they often impinge harmful side effects on the patients making use of it. However, some alternative methods and tools can help support treatments in the mental health field. From the physiological realm to the cultural perspective, research show that music has the capability to modify and drive human emotions, mood, and movement. And so, music can be a powerful tool and serve as means to diminish the dependence, volume of use, and therefore side-effects of such medicine.
Music can induce down-regulation of the nervous system, providing relaxation, and in combination with technology, music technology has the potential to supply powerful tools to promote not only better mental health, but also raise awareness of internal bodily processes, supplying access to physiological data that can be valuable to manage psychophysiological processes.
This blogpost is a synthesis of my master’s thesis developed for the MCT program - so if you are interested in the subject, you can read the full thesis, check the code (p5js) developed, explore the literature review with scientific research on the field, as well as the supplementary material on Zenodo publication.
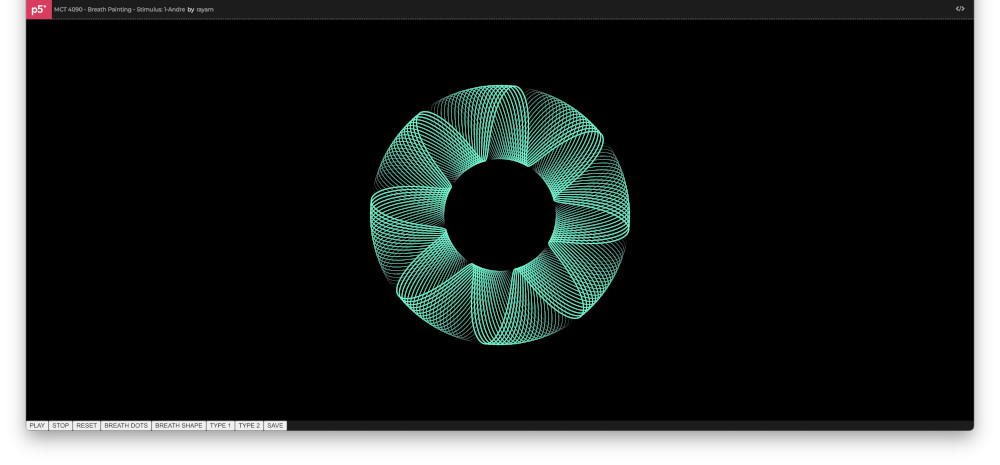
To play with and explore the prototype’s (very simple) interface, access the link Breath Painting and scroll down to find the buttons.
Motivation
Personal Reasons
Music and emotion are deeply connected in the human experience. Throughout my entire life, music has been an essential support to deal with traumatic events and difficult emotions. Since I was young, I found music a safe space where I can express myself and let emotions flow through. During my bachelor’s in Graphic Design I realized how music is deeply associated with visual representations in my perception, and that seeded my interest in creating immersive visual and musical interactive experiences, which brought my focus to Interaction Design within the graphic design field.
Recently in my adulthood, I started to deal with symptoms of post-traumatic stress disorder (PTSD) as a consequence of acute traumatic events categorized as “Big T Trauma”, being diagnosed later on with complex PTSD.
As a person that plays and composes music, music has been always an important part of my well-being and expression as a human, but only in the recent years, during this master’s program, I have found out the healing music of great composers such as Hiroshi Yoshimura, Brian Eno, Jon Hopkins, Harold Budd, East Forest, and many others which has opened up a new world for me. I have been using this type of ambient music (or healing music if you will), in my self-work and it has shown me clear benefits and potential out of my own experience. That led me to connect the dots, and so I decided to investigate how music can be beneficial for mental health through the lenses of science.
Music, Technology, and Mental Health
“The general response to both physical and psychological stress is the activation of the sympathetic nervous system (SNS) with inhibition of the parasympathetic nervous system (PSNS).” (Ziegler, Michael G., 2004)
Research show that music can affect the autonomic nervous system in different forms. Music can entrain the respiratory and cardiovascular systems, and induce different types of emotions.
The purpose of this project is to use music and technology combined to support mental health treatments and maintenance. Some key concepts were explored and are worth mention here in this post.
Biofeedback is a technological component that fits the purpose, helping to bridge the gap between internal physiological processes and the patient’s perception of these processes, which creates a vast number possibilities. The use of biofeedback in gamification systems for example, can help patients to be aware of their own physiological internal state, while engaging on activities that can help to regulate their autonomic nervous system’s activity. It can be specially interesting for children, but not only children, studies show that adult individuals also benefit from the effectiveness of the use of these tools.
Gamification is another interesting concept for this matter. It is a technique that utilizes features of the gaming experience in non-gaming contexts. It is widely used to provide users engagement with a product, and it is effective for educative purposes. Studies observed that gamification techniques have great potential in stimulating individuals for the accomplishment of tasks. In the article “User-Centred Design and Usability Evaluation of a Heart Rate Variability Biofeedback Game” (Wollmann, 2016), results validate this hypothesis, showing that visualization techniques in a gamification context were effective in creating engagement for specific applications such as heart rate variability biofeedback training.
Healthcare and well-being can benefit from the use of gamification and biofeedback since these are tools that potentially support maintaining the physiological system working in balance. The paper “Help me Relax! Biofeedback and Gamification to improve interaction design in healthcare”, analyses the user experience by utilizing the combination of biofeedback and gamification for well-being purposes. The former demonstrated to be an efficient tool to provide joy and engagement to healthcare applications (Spillers, 2012).
Aim
The goal of this project was to investigate how music affect human psychophysiology and the potential uses of music in combination with technology to benefit the mental-health and well-being of individuals.
The prototype proposed further on in this project aimed to raise awareness of the capability of music as a tool to modify physiological patterns and consequently regulate an individual’s autonomic nervous system. Music technology can support health care and psycho-therapeutic treatments, helping to prevent mental disorders such as anxiety, depression, stress, and bipolar disorder. Altogether, the combination of a biofeedback interactive system, with gamification techniques and conscious breathing can be a powerful tool to support mental health and wellness, and this project will describe how.
The prototype consists in a code that generates visualizations of breath and music data, which I am calling “Breath Painting”. These visualizations have the potential to feature music apps focused on relaxation and wellness, integrating gamification tools for mental health support applications, or educational purposes by raising awareness of the importance of music and respiration for the human mental health. It also can be used for the practice of resonance frequency breathing, which is proven to be an efficient technique used for regulating the autonomic nervous system.
Breath Painting: A biofeedback based data visualization tool
Breath Painting is the name given to the prototype that I developed for this project. The objective of this prototype is to provide unique visualizations of the correlation between breath data and music data from an individual’s music listening experience. The prototype takes numbers as input and translates them into dynamic geometric shapes and colors, as means to convey information about the synchronization in behavior between the two types of data. For this project, the objective of the visualization is to display technical data with an artistically engaging approach. In sum, people from any educational background will be able to visualize how different types of music modulate different breathing patterns. That is why the prototype was named Breath Painting.
Biofeedback and data representation techniques are not a new technology in our time, the term “biofeedback” has been explored since the late 60’s, while the first heart rate data sonification device, a room-sized machine called electrocardiograph, has been in use since 1902. The same applies to data visualization techniques, they have been around with well-developed cartography since the 16th-century. On the other hand, the combination of all these techniques together, with modern technology and advanced apparatus, opens up a whole universe of possibilities.
The possibilities provided by data representation techniques such as data visualization and data sonification are appealing to me. The fact that we can visualize the internal bodily process, and listen to alterations regarding an individual’s psychophysiological activity sparkle endless creative solutions that can be at the same time, effective for medical use, and artistically instigating.
This is the reason why the idea for this prototype was born. By combining such techniques, it is possible to create an interactive system that receives biofeedback input from the user’s respiration data and translates it into graphic information. The idea is to raise awareness and induce people to breathe mindfully and with quality. That process can be supported by data sonification, where sounds indicate when the user’s breath is in resonance and stable, or when it is too fast and unstable.
Programming Language
During the product research process, I started searching in parallel for a suitable programming language in the context of visual arts. Amongst several options, highlighting Pyhton, JavaScript, and Processing, I concluded that JavaScript was the most convenient programming language, using the library p5.js and the p5 web editor as the framework. This choice was taken considering economical accessibility, time frame, features, experience with coding languages, and open knowledge available.
Data
The breath and music data inputs used in this project were collected from the experiment “Headphones/speakers Experiment, 2018” (Jensenius, 2021) at the University of Oslo, part of the “MICRO - Human Bodily Micromotion in Music Perception and Interaction” project, which studied how music and rhythm influence the human body motion. The goal of the “Headphones/speakers Experiment, 2018” experiment was to analyse the body motion and rhythm entrainment while listening to music, exploring how the motor responses would differ if the listener were using headphones or speakers.
The participants were 42 persons signed up at the University of Oslo, without any impairments or medical conditions that would impact the results of the study. All the subjects listened to the same audio sample through headphones and speakers with systematic variation of the order of the samples and the listening device used. Every session starts with 30 seconds of silence, and presents the audio stimulus (45 seconds each) in different orders, having a 30 seconds interval between each song, and at the end.
Audio Stimuli list:
- Andre (EDM track with a low level of complexity)
- Metronome (Metronome track based on a drum sample)
- Neelix 1 (Trance track with complex rhythmic structure)
- Neelix 2 (Same as Neelix 1 track but different section: a rhythmic and glissando build up)
- Pysh (Deep house track with a steady, but slightly laid-back beat)
- Rhythm (Simple two-measure drum pattern)
Audio Data Visualization
After organizing the data received, I started working on solutions for the audio data visualization. The first step taken in the process of transforming sound data into visual information, was to obtain musical information from the audio file that I prepared.
The most common type of audio signal visualization which most people recognize is the waveform. A waveform graphic displays the audio signal’s amplitude changing in time. Adding another dimension of information along with the audio amplitude, spectrograms are a more complex and detailed tool for audio data analyses. Spectrograms provide a visualization of the frequency content intensity and amplitude varying with time. Commonly, spectrograms are displayed as heatmaps. Whereas the frequency content is typically represented by the colour location on the y-axis, the amplitude is classically displayed as the brightness of the colour, and the x-axis is the time dimension.
As a first approach to this project, I opted for the spectrogram to represent the audio stimulus data visually. I took this choice considering that the spectrogram provides information regarding the frequency content and amplitude of the audio, allowing interesting correlations between the audio stimulus and the breathing data responses over time. In this case, however, I opted for developing a circular spectrogram for artistic purposes. A circular representation denotes the impression of a cyclic narrative to the visualization, which relates to the cyclic character of the breath, and also to the way music has been reproduced on analog media like a vinyl record for instance. Moreover, a circular visualization looks artistically appealing to the general user, dissociating it from the classic chart style and other classical technical representations for audio data.
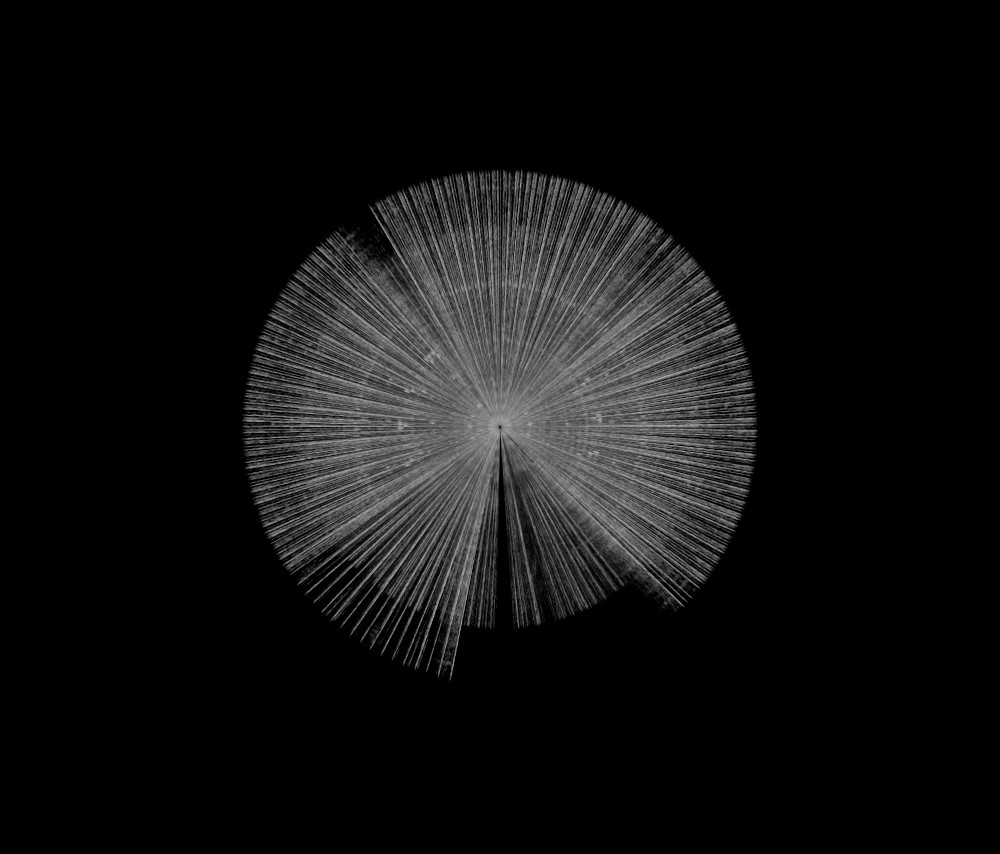
With this visualization, it is possible to see the audio data behavior in time, possible silent gaps, parts where the audio is mostly in the low-frequency range, and some emphasized frequencies. Although it was an interesting figure by itself, it still can be improved in terms of clarity and aesthetics, and more importantly, it needs yet to interact with the breathing data.
Breath Data visualization
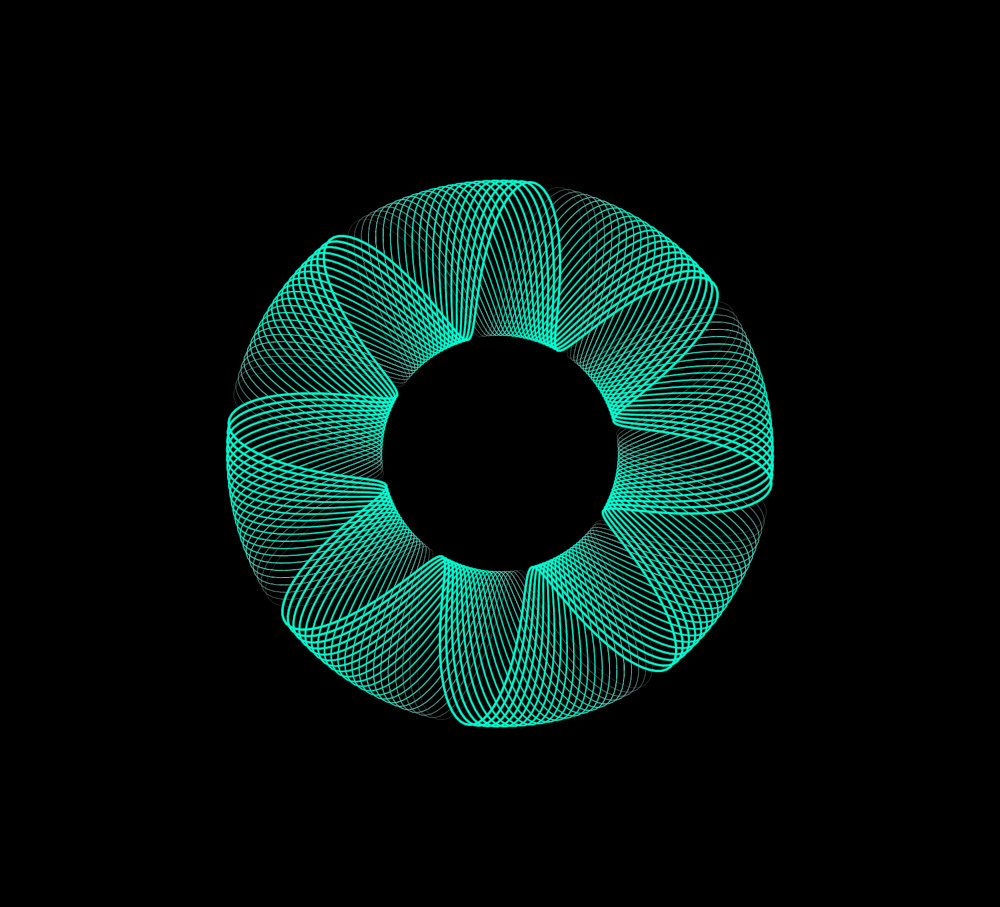
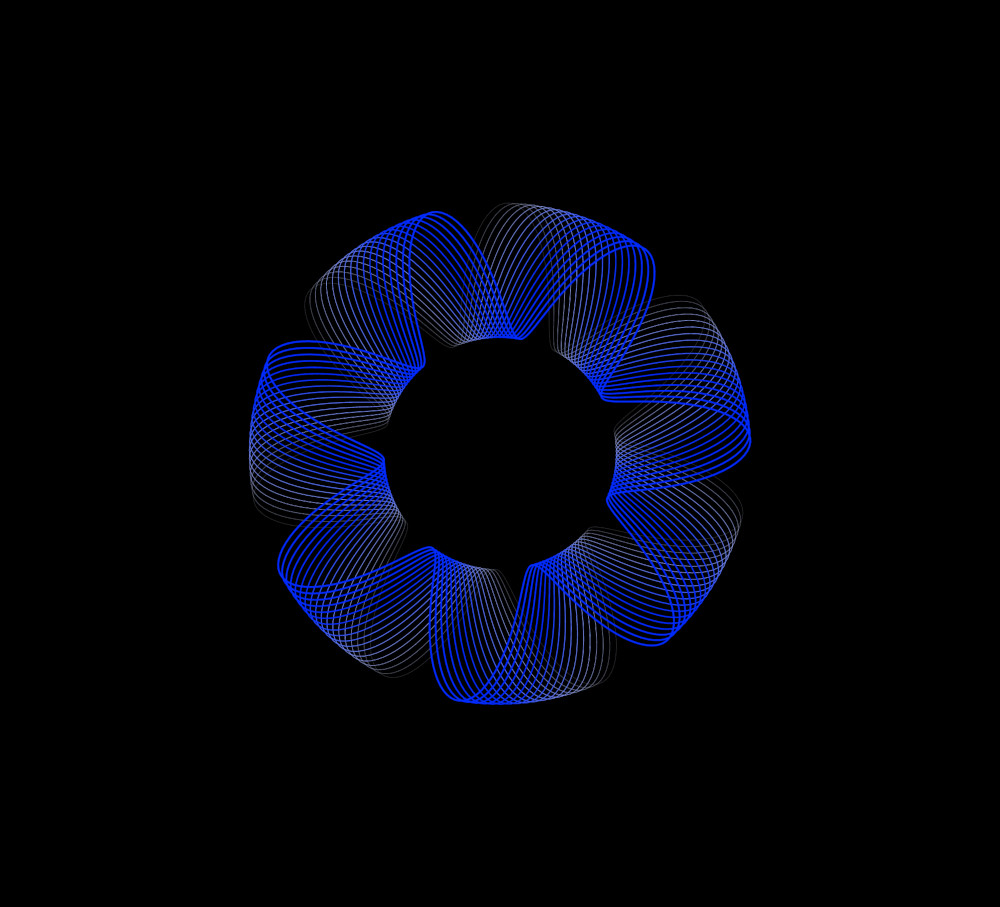
Choosing a visual structure to represent the breath data was an iterative process. After several tests, I found a structure that represents breath from a conceptual perspective but also that carries aesthetic consistency regarding a symbolic representation of breathing. The most important in this case was that the chosen shape has a friendly code structure that allows the mappings to provide meaningful progressive changes on the shape, that can be understood in terms of data behavior.
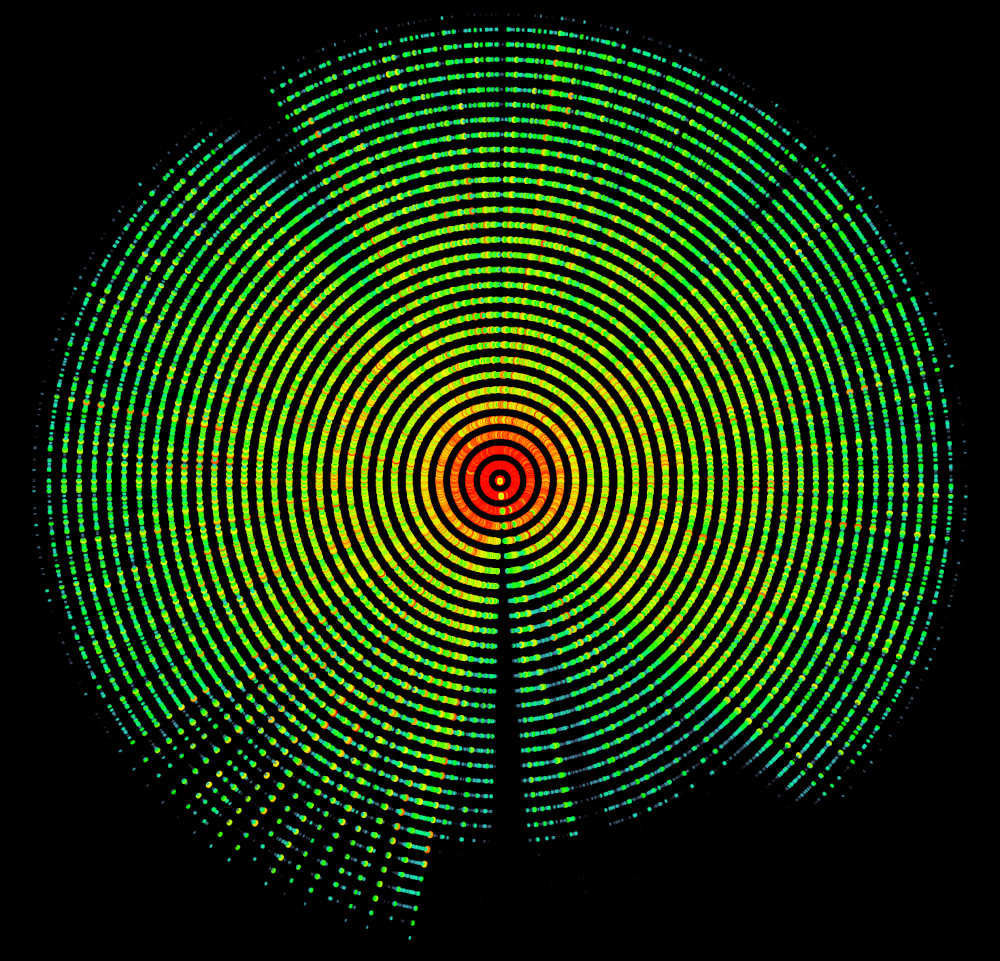
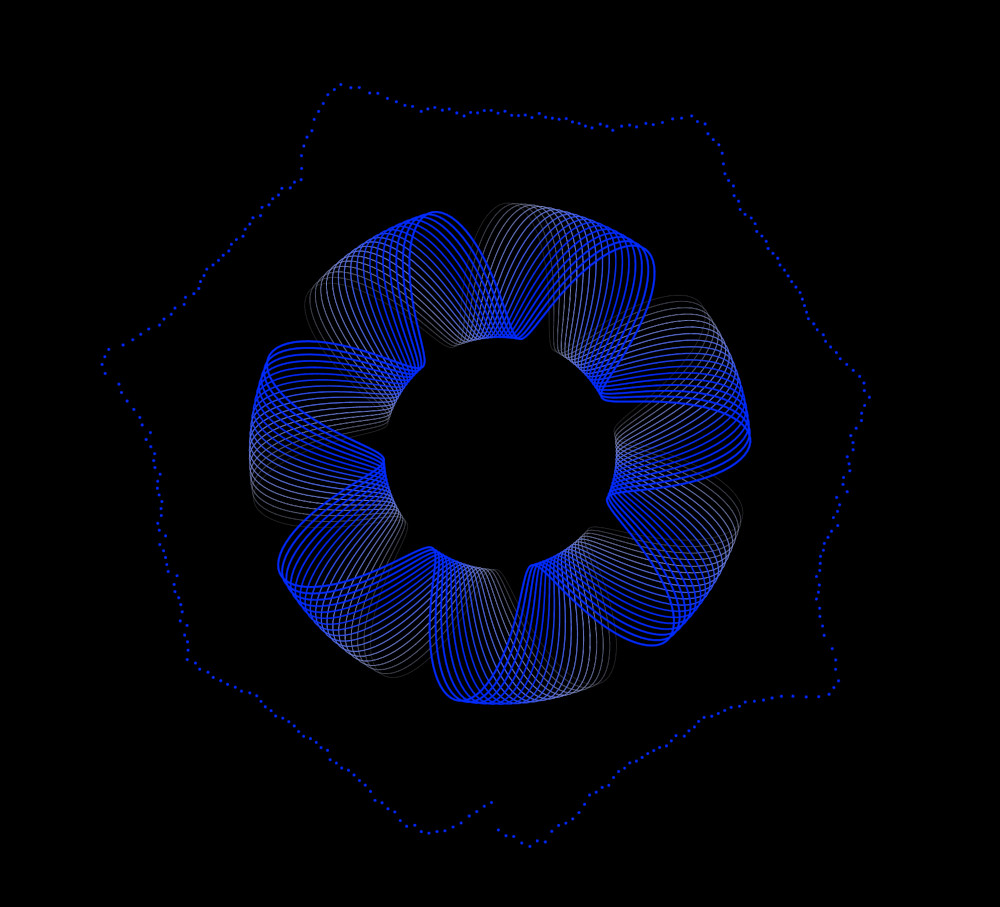
Following the process described below it is possible to see the iterative progression, starting with the breath data represented by dots in a circular structure overlaying the circular spectrogram generated by the music stimuli of the session represented by the data. Both audio and breath stimuli visualizations respect a linear progression of the data in time.
After plotting the overview graph including the song and silence sections I could observe that the intervals between each wave get gradually shorter as the session develops towards the end, suggesting that the breath rate becomes higher in the second half of the session. It also shows that the inhalations become shallower contrasting to the deeper contraction of the chest indicating deeper exhalations by the end of the session. Another observation is that it is not clear if the silence sections are influenced by the preview music stimuli or if it is directly showing the result of the silent moment on the breathing patterns. That interpretation can be more accurate if one knows how fast the breath patterns are responding to the immediate stimuli, be it silence or music.
The initial approach taken was to map the mean, standard deviation, and variance of the sections of the data in order to understand more about the breath characteristics of the selected section, and to synthesize this information into a shape that can convey such information.
Mappings
Once I understood the structure building the shape, I started testing how different measurements of the data would behave as input of the main variables in the structure. The measurements are listed below:
- Mean
- Standard Deviation
- Variance
- Maximum value
- Minimum value
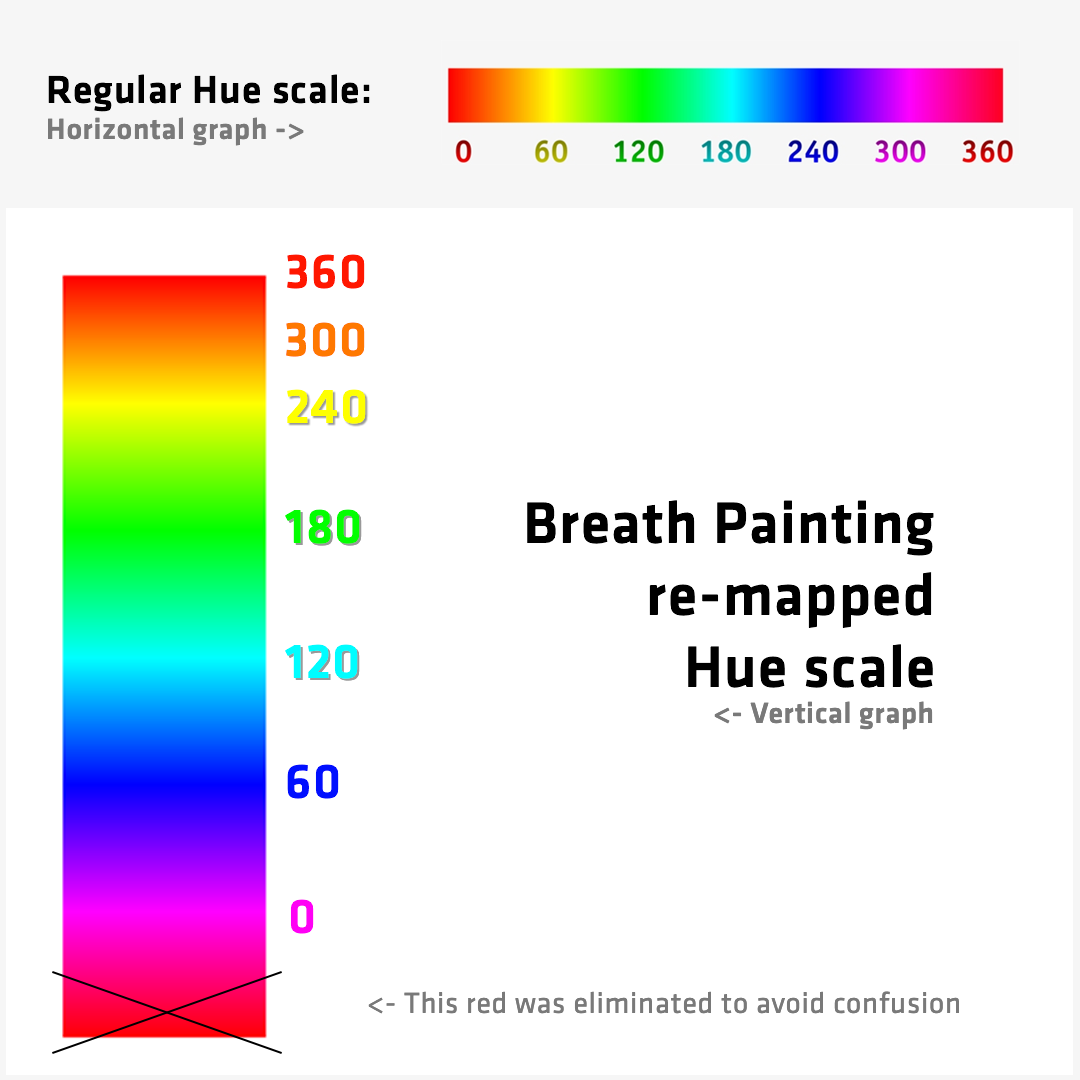
These measurements were used to create the following mappings, which are a result of a testing process with several iterations. Some of the values were mapped to fit the variable value range, e.g.: the color Hue that goes from 0 to 360.
- Number of lines = Standard Deviation
loop(i = 0; i < Deviation; i++)
- Number of petals = Standard Deviation
map(Std. Deviation, 0, (dataMax-dataMin)/4, 2, 15)
- Inner circle circumference = Minimum session’s value (exhalation)
dataMin/10
- Outer circle circumference = Maximum session’s value (inhalation)
map(dataMax, dataMin, dataMax, 200, 290)
- Stroke Hue = Variance
map(Variance, 0, 1000, 350, 0)
- Stroke Saturation = Mean
map(Mean, dataMin, dataMax, 1, 20) * i (the saturation value is mapped Mean value to a range, between 1-20 that when multiplied for the i of the for loop, generates a movement effect)
- Rotation angle = Mean
map(Mean, dataMin, dataMax, 1.5, 3)
These correlations allow the user to understand the behaviour of the breath by observing the characteristics of the shape generated from the breathing session. Therefore, one can read the different arts produced from different “music-breath” sessions and compare them, also understanding how the music ‘looks like’ during each session, by analysing the spectrogram of the sound listened during the session.
To simplify the understanding of the mappings above, I decided to create a legend that can serve as a guide for the user to read the art generated by their “breath-painting” sessions.
-
The greater the number of lines (and complexity) on the shape, the bigger the deviation, which suggests that the breath session was unstable, varying in quality (deep or shallow breathing).
-
The same applies for the number of petals, more petals meaning more variation on the breath pattern.
-
The smaller the inner circle circumference is, the deeper exhalation performed during the session.
-
The bigger the outer circle circumference is, the deeper inhalation performed during the session.
-
For the color Hue value, the warmer the color (from purple-blue-cyan-green-yellow-orange to red), the greater the variance of the session was, which indicates that the user performed an inconsistent breath pattern. The closer it gets to the red color, suggests a tendency to aroused states, while the more consistent the breath is, suggests calmer states represented by colder tones closer to the blue color.
-
The stroke saturation also indicates the level of variance. If the saturation is low, it means that the variance of the session was low, suggesting stable breathing patterns. The opposite applies: if the saturation is high, it indicates an unstable breathing pattern.
-
The rotation angle affects the shape creating unique results for each session. The interpretation of this variable is not as clear and informative as the other mentioned above in this list. It is based on the Mean of the breathing session, and it was mapped for aesthetic purposes.
Arts Generated (results)
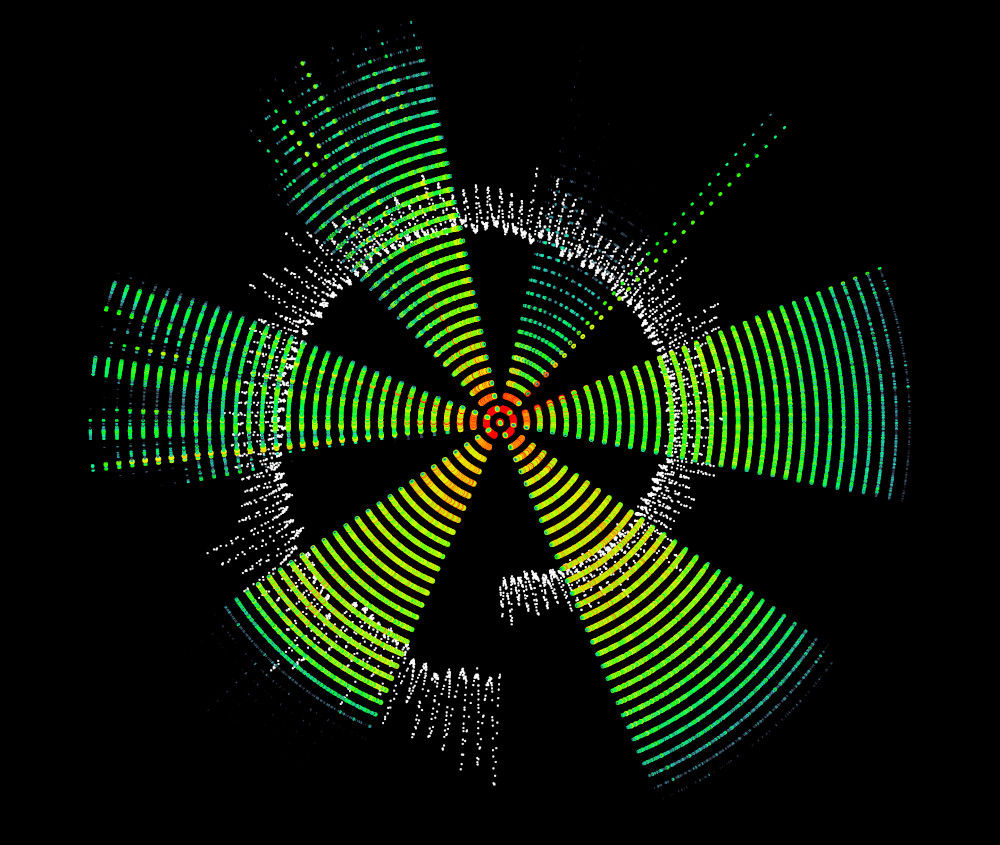
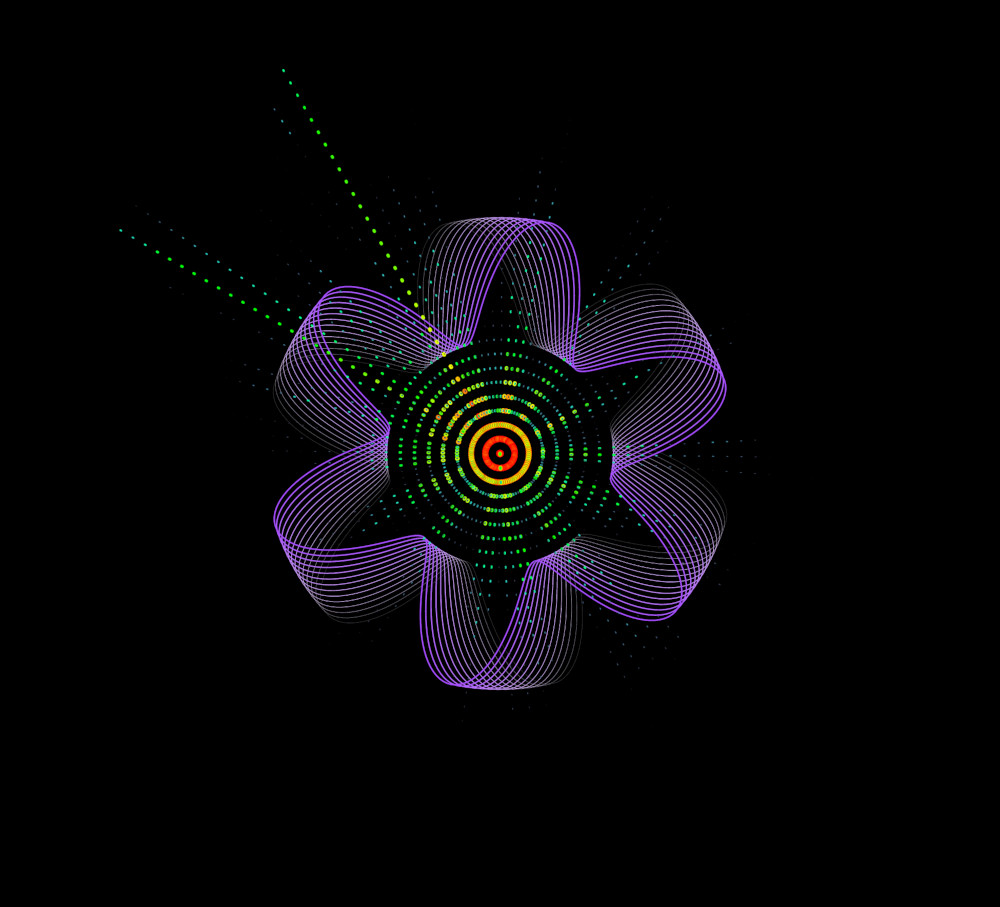
To make viable the correlation between the musical stimuli and the respiration behavior, both types of data are drawn on the same canvas and can be displayed simultaneously with a harmonized aesthetic. By displaying the draws simultaneously, the interface allows the user to compare and visualize the development of the breath session in parallel to the music stimuli within the time domain.
Prototype interface
To help test and export all the arts mentioned previously, it was helpful to develop a basic interface. The interface of the prototype is extremely simple but it serves the purpose, as it is not a final product. It is basically eight buttons in sequence on the bottom of the screen, that were implemented for testing the arts in different combinations. The first and second buttons are for audio reproduction. The first one is a PLAY button that switches to the PAUSE function, so the user can reproduce and pause the audio loaded in the code. By default, the audio stimulus pre-loaded is “1-Andre.wav”, matching the data segment pre-selected by default as well. It also draws the spectrogram in real-time with the audio reproduction. The second is a STOP button, to stop the audio and the spectrogram drawing action. The third button is a RESET button, made for resetting not only the audio reproduction, starting again from the beginning, but also to reset the canvas, erasing any art plotted. The fourth button is called BREATH DOTS, and as the name indicates, it plots the dotted breath data. The fifth button is called BREATH SHAPE, and it plots the breath shape, as the name suggests. This one should be used when the breath shape is not plotted, for instance when the user resets the interface. Then, the sixth and seventh buttons are TYPE 1 and TYPE 2, with the function of switching the breath data types. And finally, the last button is a SAVE function, with which the user can export/download the art generated.

Future work
A lot of improvement can be done to this project. There is room for exploration of the breath and sound visualizations, and the interaction between them.
The breath shapes, for instance, can be improved in terms of clarity. One way to do that is to increase the differentiation between sessions, making the interpretation faster and clearer. As this type of data is not dramatically changing between sessions (if the user performs natural breathing), the differentiation can be enhanced with mappings that make smaller variations output greater modulations on the structures, broadening the spectrum of changes.
The audio data can also be approached differently. It could become a modulator of the shapes generated by the breath data. With smart mappings, colors and other details of the geometry can convey the audio data keeping the time dimension, frequency, and amplitude information by translating it into different visual attributes of the breath shapes.
Moreover, user experience research can improve significantly the efficiency of this prototype. It would be interesting to test different compositions for the visualizations and ask questions about the understanding of the users regarding the information conveyed. That would also provide input concerning user engagement. An addition that could improve the user’s experience and help educate the users about their breathing patterns would be to implement a legend for understanding the quality of their breathing patterns according to the art generated. A legend can help the users to compare their type of art to reference arts that can guide them to evaluate their Breath Painting. In addition, useful tips for healthy breathing can be implemented in the user interface of the prototype. These tips can be displayed according to the user’s breath session, for instance, if the session shows inconsistent breath patterns, or shallow breathing, the user can get tips on how to improve their breath practices, and can be oriented to follow and align their breath pace with a suggested sedative slow music with visuals that induce a deeper and consistent breath pattern.
This prototype can also be developed to be interactive in real-time with sensors and devices that can open doors for biofeedback systems and gamification. It can be used for educational purposes applied to health by stimulating the user to breathe deep and slow, or leading the user to discover their particular resonant breathing frequency. For example, the visuals can respond to the user’s breath in real-time, with visual rewards such as the appearance of beautiful elements, or the unpleasant visual indicators that the user is out of track with their respiration. The interactive system can play with the user’s engagement by displaying new appealing elements and sounds that are triggered by the correct bio-data (in this case the breath data) input provided by the user.
Another possible application of this type of system is generating visual elements and composing generative music simultaneously, providing an immersive experience to the user. That can be done by using the biofeedback data output coming from a breath sensor as a trigger, and modulator, for a generational music system that interacts with the visuals that are also modulated in real-time by the breath data of the user. For example, a calming environment like a forest, with nature sounds that blend into the music, together with visuals that are revealed as the user’s breath syncs into a desired rate, would be an effective way to educate and induce relaxed states for the users. Kids could also benefit from other environments more appropriate for children. With playful elements, as the kid breaths slower and deeper, the environment displays colorful objects that bounce, for instance. That creates engagement, educating and motivating the child to learn healthier breath practices, consequently providing well-being.