Sonification of Standstill Recordings
Introduction
Music and body motion are strongly interconnected. As a drummer, I always feel strongly connected to the music with my motion in a performance and I am fascinated by how a genre or the type of music influences the body movements. During the studies in Music, Communication and Technology study program, I had the opportunity to actively participate in the Norwegian Championship for Standstill competition in 2019 and grasp the methods of the whole process starting from setting up the Motion Capture system to choosing the final winner of the competition. The MoCap system outputs a rich continuous data stream with a larger number of data points and my motivation behind the thesis was to combine this data stream with sound to hear the participants’ movements. Moreover, this implementation can be used as an instrument for a “Standstill performance” and opens a new door for a sonic interaction space with human micromotion.
Research Questions
The thesis is based on One main research question and two other sub-questions. From the main research question I wanted to broadly addresses on exploring the connection between the music and involuntary motions of the body.
How can sonification be used as a method to explore music-related micro-motion?
During the Norwegian Championship of Standstill competition, the participants are in a forced condition to not move. And based on past studies, there is statistical evidence that music stimuli have an impact on standing still. Apart from using a visualization method to analyze the micromotion, sonification can be used to listen to the data and find out any audible patterns. The main objective of this question is to find out what kind of difference can be noticed in the motion during the music stimuli is played and whether the sonification can reveal any information that was not visible in statistical studies.
- What kind of motion patterns are audible from the standstill competition data?
- How can spatial audio be used in the sonification of human standstill?
Building the application for sonification
The sonification is applied for data from the 2012 standstill competition data. Initial idea was to build a prototype using the 2012 standstill data and use it for the exploring rest of the database including yearly data for the competition. According to Jensenius et al. (2017), around 100 participants were joined the study, and the final data set consists of 91 participants. The sessions were held in groups for about 5-17 participants at a time. For making the sonification, I decided to use the Max/MSP environment. Due to the steeper learning curve, lack of coding experience, and limited time frame, using a programming language such as “supercollider” or “Python” felt like an unrealistic goal for this thesis. Max/MSP provides a great GUI based programming environment that has a much faster learning curve and also a large community of users which is helpful.
Data Set
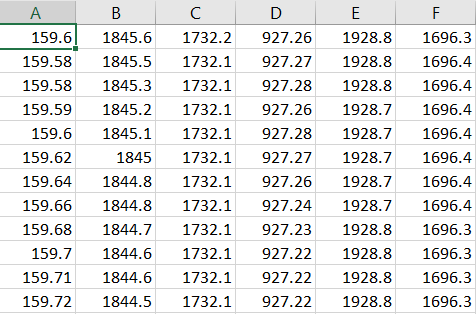
From the recorded data, two data sets were available to use for the sonification. The first data set consists of all the x, y, z position data for each participant, which is 273 columns and 35601 rows of data.
The second data set is based on the demographic data of each participant and consists of quantitative and qualitative data. I like to mention the data variables that consist of the participant demographic data set. Which are the group each participant belongs( A, B, C, D, E, F, G, H, P), Participant number, Age, Sex, Height, Music listening hours per week, Music performing/production hours per week, Dance hours per week, Exercise hours per week. And some measurements were based on a Likert-Scale: Tiresome experience of the session (1 to 5), Experienced any motion (1 to 5), Experienced any motion during the music segment (1 to 5). Two other variables indicate if the participant had their eyes open/close or had locked knees/or not during the experiment.
Sonification Strategies
I used parameter mapping sonification with three different approaches which are,
- Sonification of individual participant data.
- Sonification of group average position data.
- Using spatial sound with individual position data.
In each option, the first half of the data (3 min) represents the participants standing with silence and the second half (3 min) with the music stimuli. In that way, one of the aims was to experiment if the sonification can reveal information on how the music stimuli affect the motion during standing still. Another aspect was to explore how keeping the eyes open/closed or having locked knees can affect the motion. According to Jensenius et al. (2017), there was no statistical evidence that these factors affected the micro-motions. Minimum and maximum position values of each Axis x, y, z was calculated for each participant in Excel and these values were used for scaling the parameter values during the mapping process.In the standstill experiment, data were recorded at a rate of 100hz and each session lasts for 6 minutes. Listening to the sonification faster than real-time can provide better insights on the patterns that occur in the data set and the first step was to implement a strategy to read the data from the CSV file and have the option to change the data reading speed.
Displacement of Position
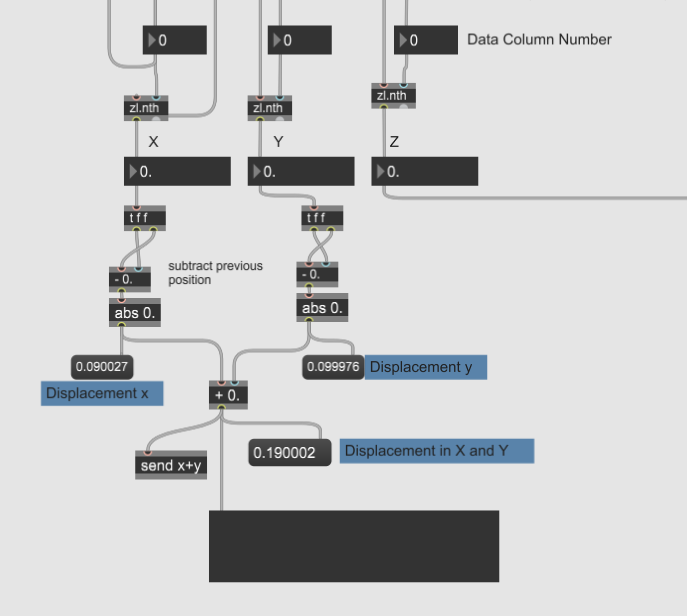
Instead of directly mapping the x, y, position data, a new variable is defined which is the displacement of the position. However, I’m not dividing the displacement of the position by the time factor to calculate the rate of change of the QoM since the rate of the displacement also depends on the chosen sample rate in the patch.
Figure 3.3 shows a part of the patch which calculates the change of the position (displacement). First, the displacement of position is calculated for each axis of data. In each moment, the previous position value is subtracted from the current position value and the absolute value is calculated. By using this value, the displacement can be derived for each plane (XY, YZ, XZ) by pairing the sums of individual position displacements for each x, y and z Axes. According to the results of the study by Jensenius et al. (2017), most motion is happening in the XY plane, and in the sonification, primarily the displacement of the XY plane is considered.
1 . Sonification of Individual Participant Data
As presented in Figure 3.4, displacement position values in the XY plane or position values of the Z-Axis can be selected for the sonification. For mapping in the noise section, the total displacement of position in the XY plane or the position values from the Z-Axis can be mapped to the amplitude of the noise and to the cut-off frequency.
2. Sonification of Group Average Position Data
Figure 3.4 is an extract from the max patch that calculates average displacement values for each x, y, z Axes for two participant groups. However, this patch is only compatible with the 2012 standstill data and since the average values depend on the number of participants in the group, further customizations are necessary to use it with other standstill competition data sets. In the mapping, a similar approach to the individual participant mapping has being followed. The average position values are used to calculate the average displacement position values in the XY plane and mapped to control the noise amplitude and cut-off frequency or the Sine tone frequency and amplitude. Also, the average Z-axis values can be used to control the parameters of the noise section or the sine tone.
3. Using Spatial Sound with Individual Position Data.
The third approach of the sonification is to apply spatialization for the position data. The position values of x, y, z Axes represent a location in the three-dimensional space and these values are used to “sonify” the motion using spatial attributes of a sound. The spatialization approach is developed by using the ICTS10 ambisonics module for Max/MSP. It allows to simply input cartesian coordinates (X, Y, Z) or spherical coordinates (Azimuth, Elevation, and Distance) and render the sound output for a speaker system or headphones. In this patch, the position data is only controlling spatial parameters of a sine tone.
Results
Mapping a white noise with data variables.
First, I would mention the results for the mapping of white noise with data variables. The mapping of white noise to displacement position variable with a 100 Hz sample rate of data playback, produced a sound of rising and falling of the frequency filtering and the amplitude. These fluctuations were present for all three participants. These up and down movements of the sound can be distinguishable in three levels. First, a darker sound can be noticed with less volume which stays much stable with fewer fluctuations. These low fluctuations of the noise can probably explain by the stability of the standing still. Secondly, a much sharper rising and falling of the noise is noticeable for 5-15 seconds periods of time. The periodicity of these sounds is not sharply consistent. These sounds are shorter rises that last for about 2 seconds but clearly stands out from the much stable darker noise. These rising and falling of the noise can be related to the breathing patterns of the participants. Statistical evidence was found in previous standstill studies regarding similar periodic movements (Jensenius & Bjerkestrand, 2011). Thirdly, sudden quick bursts of the noise can be noticed, and they occur less frequently and not in any noticeable cycle. This type of sound may be occurring due to postural adjustments of the participants. As described in a study by Jensenius and Bjerkestrand (2011), some “spikes” that appear every 2-3 minutes were noticed in the analysis and these were assumed as postural re-adjustments.
Mapping Z- Axis values
Moreover, an interesting phenomenon was noticed in the mapping of Z-Axis values. By listening to the mapping of Z-axis values with the sine tone, a gradual dropping of the sine tone frequency was noticed for all three participants. It can be noticed that the sudden fluctuations of the sound are very low compared to the fluctuations noticed in the mapping of displacement position values. Which could potentially result because of the less up and down movements of the head when standing still (Jensenius, 2017). The gradual drop of the sine frequency may probably be indicating a gradual fall of the position for standing over a longer period. As mentioned in a previous study of a standstill experiment, “This could be an indication that we ‘sink’ a little when standing still over time, but the numbers are too small to point to a strong conclusion” (Jensenius et al., 2014). And a sudden rise of the frequency can be noticed after certain frequency drops. This can be possibly due to the reason of participants re-adjust their postures by trying to straighten their back (Jensenius, 2017). Also, this falling of the sine frequency is strongly noticeable towards the very end of the session, and this might be indicating a falling of the posture due to fatigue for standing for a longer period. Moreover, two of the three participants (participant 1 and participant 10) indicate a dropping in the frequency of the sine tone after halfway through the session and keep a lower frequency until the end of the session. This might be indicating that the participants tried to relax the body to maintain the stillness when the music starts and resulted in a sudden falling of the height. However, this must be tested with a larger number of participants before having a strong confirmation.
Let’s listen to an audio sample.
Applying spatial audio
Finally, mapping the position values for spatialization produced an interesting moving pattern in the ambisonic sound field. But any regularity or periodicity of the patterns was not noticed. However, details on the elevation of the sound are not accurately perceived from the headphones due to the lack of a binaural rendering option in the ICTS module.
Conclusions
Now I would like to address my main research question and the sub-questions, based on the development and the results of the sonification process. First, I would like to consider the two sub-questions.
- What kind of motion patterns are audible in standstill competition data?
By considering the results of the individual participant data sonification, the most noticeable finding is to be able to listen to the falling and re-adjustments of the posture of participants. As a previous study of standstill mentions, more strong evidence was needed to conclude the downward movement in the Z-Axis data (Jensenius et al., 2014). However, by listening to the sonification, this effect of falling of the posture is clearly audible and provides strong evidence that there is a noticeable gradual downward movement and sudden rises of the position marker along the Z-axis. Furthermore, the mapping of the noise with the position displacement variable provides supportive evidence that the breathing patterns and postural adjustments are audible from the sonification. However, a stronger investigation is needed to confirm the periodicity of such events at “Meso” and “Macro” temporal levels. But the sonification indicates that the micro-motions are in a reasonably stable state and have consistent motion.
However, by listening to the sonification for the sections with music and without music, it is difficult to notice any comparable differences between the movement patterns. By listening to the sonification, it is difficult to notice if the participants’ motion shows any synchronization to the music stimuli or not. But it was possible to notice a falling of the height (falling of the posture) when the music stimuli start, and towards the very end of the session. Moreover, by listening to the sonification, any recognizable effects on the micro-motion according to different postural choices such as keeping eyes open/close or keeping the knees locked/not locked was not noticeable.
- How can spatial audio be used in sonification of standstill?
The possibilities of using spatial audio with the sonification of standstill are not fully examined in this thesis. By maintaining proportionality between the x, y, z position values in the spatial mapping, tends to produce a less noticed spatial movement of the sound due to the very small range of motion (micro-motion). However, another approach would be to expand the micro-motion by mapping the range of each x, y, z axes values into a larger range. But the patterns that audible in the ambisonics sound stream are not explainable with strong evidence and doesn’t explain how these motions of the sound can be related to the micro-motion. Further, the development of the model is necessary to effectively draw any strong conclusions of the spatialization of the sonification.
Finally, I would like to reflect upon the main question of the thesis:
How can sonification be used as a method to explore music-related micro-motion?
According to the results of the analysis of sound samples, a conclusion can be made that through sonification it is possible to identify patterns and events to a certain extent, which were not clearly visible in the visualizations of the standstill data. The introduced sonification modules, however, provides less opportunity to actively compare between sections. As an example, comparing a data section with music stimuli and without music stimuli was a difficult task since due to the high irregularity of the sound patterns. This kind of audio comparison demands a high skill of actively memorizing and comparing a certain characteristic of the patterns. One way to avoid this kind of complexity is to play different data streams simultaneously with each stream assigned with a unique distinguishable sound. As an example, mapping the position data of two participants into two frequency ranges of a sine tone and listening to both audio streams simultaneously. However, when developing such a sonification model, the psychoacoustic phenomena of “masking” should be potentially considered. The mapping of the position displacement values with the noise seems to produce a more effective and pleasing sound compared to the sine tone. A fluctuation of the filtered noise was mostly sounding closely related to the sound of breathing and felt more natural. And the sine tone seems to be an appropriate mapping for the values of the Z-axis since the gradual dropping of the frequency was more appealing to represent a downward movement of the position. The use of white noise seems to be aesthetically appealing. Using pleasant and natural sounds tend to improve the efficiency of a sonification model(Susini et al., 2012) However, these aesthetically pleasant sounds can also have the potential of distracting the listener and hide the important information from the sonification (Vickers & Hogg, 2013). Having a perfect balance between these factors is a challenge when designing a parameter mapping sonification for data exploration. Another aspect to consider in the mapping is the perceptual correlation between sound parameters. As an example, frequency and gain both contribute to the loudness parameter where higher frequencies tend to be perceived as loud or bright. As Grond and Berger (2011) point out, an efficient mapping for loudness can be achieved by applying a proper frequency- dependent amplitude compensation technique .
As final thoughts, the sonification models developed in the thesis are mostly appropriate for navigating through the standstill data set and gain a quick overview of the data patterns. To gain the full potential of the data features, more options should be developed for data management. These sonification methods can be utilized as guides along with the visualization techniques to explore the Standstill competition data. Even though the sonification can convey useful information from the data features, a successful evaluation of the sonification process heavily depends on the skill of listening. It is necessary to develop a “skill” to actively listen to the data set and identify potential information. As Hermann and Ritter (1999) emphasize, training is necessary to interpret the sonification correctly, and thus after a longer period of training it is possible to develop expertise on identifying subtle changes and patterns.
References
Barrett, N. (2016). Interactive spatial sonification of multidimensional data for composition and auditory display. Computer Music Journal, 40(2), 47-69.
Brazil, E., & Fernström, M. (2011a). Auditory icons. In The sonification handbook.
Brazil, E., & Fernström, M. (2011b). Navigation of data. In The sonification handbook.
Brewster, S., & Murray, R. (2000). Presenting dynamic information on mobile computers. Personal Technologies, 4(4), 209-212.
Burger, B., Thompson, M., Luck, G., Saarikallio, S., & Toiviainen, P. (2013). Influences of Rhythm- and Timbre-Related Musical Features on Characteristics of Music-Induced Movement. Frontiers in Psychology, 4(183). doi:10.3389/fpsyg.2013.00183
Candey, R. M., Schertenleib, A. M., & Diaz Merced, W. (2006). Xsonify sonification tool for space physics.
de Campo, A., Frauenberger, C., & Höldrich, R. (2004). Designing a generalized sonification environment.
Dombois, F., & Eckel, G. (2011). Audification. In The sonification handbook.
Franklin, K. M., & Roberts, J. C. (2003). Pie chart sonification. Paper presented at the Proceedings on Seventh International Conference on Information Visualization, 2003. IV 2003.
Gonzalez-Sanchez, V. E., Zelechowska, A., & Jensenius, A. R. (2018). Correspondences between music and involuntary human micromotion during standstill. Frontiers in Psychology, 9, 1382.
Grond, F., & Berger, J. (2011). Parameter mapping sonification. In The sonification handbook.
Grond, F., Bovermann, T., & Hermann, T. (2011). A supercollider class for vowel synthesis and its use for sonification.
Hermann, T. (2008). Taxonomy and definitions for sonification and auditory display.
Hermann, T., Hunt, A., & Neuhoff, J. G. (2011). The sonification handbook. Berlin: Logos Verlag.
Hermann, T., & Ritter, H. (1999). Listen to your data: Model-based sonification for data analysis. Advances in intelligent computing and multimedia systems.
Hermann, T., & Ritter, H. (2005). Model-based sonification revisited—authors’ comments on Hermann and Ritter, ICAD 2002. ACM Transactions on Applied Perception (TAP), 2(4), 559-563.
Hunt, A., & Pauletto, S. (2006). The sonification of emg data. Paper presented at the International Conference on Auditory Display (ICAD).
Janata, P., & Childs, E. (2004). Marketbuzz: Sonification of real-time financial dataa.
Janata, P., Tomic, S. T., & Haberman, J. M. (2012). Sensorimotor Coupling in Music and the Psychology of the Groove. Journal of Experimental Psychology: General, 141(1), 54-75. doi:10.1037/a0024208
Jensenius, A. R. (2015). Microinteraction in music/dance performance.
Jensenius, A. R. (2017). Exploring music-related micromotion. In Body, Sound and Space in Music and Beyond: Multimodal Explorations (pp. 29-48): Routledge.
Jensenius, A. R., & Bjerkestrand, K. A. V. (2011). Exploring micromovements with motion capture and sonification. Paper presented at the International Conference on Arts and Technology.
Jensenius, A. R., Bjerkestrand, K. A. V., & Johnson, V. (2014). How still is still? exploring human standstill for artistic applications. International Journal of Arts and Technology 2, 7(2-3), 207-222.
Jensenius, A. R., Zelechowska, A., & Gonzalez Sanchez, V. E. (2017). The musical influence on people’s micromotion when standing still in groups. Paper presented at the Proceedings of the SMC Conferences.
Kaper, H. G., Wiebel, E., & Tipei, S. (1999). Data sonification and sound visualization. Computing in science & engineering, 1(4), 48-58.
Kramer, G. (1991). Audification-The Use of Sound to Display Multivariate Data. Proceedings of ICMC1991, 214-221.
Kramer, G., Walker, B., Bonebright, T., Cook, P., Flowers, J. H., Miner, N., & Neuhoff, J. (2010). Sonification report: Status of the field and research agenda.
McGookin, D., & Brewster, S. (2011). Earcons. In The sonification handbook.
Mynatt, E. D. (1994). Designing with auditory icons: how well do we identify auditory cues? Paper presented at the Conference companion on Human factors in computing systems.
Nasir, T., & Roberts, J. C. (2007). Sonification of spatial data.
Polli, A. (2004). Atmospherics/weather works: A multi-channel storm sonification project.
Ross, J. M., Warlaumont, A. S., Abney, D. H., Rigoli, L. M., & Balasubramaniam, R. (2016). Influence of musical groove on postural sway. Journal of Experimental Psychology: Human Perception and Performance, 42(3), 308.
Susini, P., Misdariis, N., Lemaitre, G., & Houix, O. (2012). Naturalness influences the perceived usability and pleasantness of an interface’s sonic feedback. Journal on Multimodal User Interfaces, 5(3-4), 175-186.
Vickers, P., & Hogg, B. (2013). Sonification Abstraite/Sonification Concr\ete: An’Aesthetic Perspective Space’for Classifying Auditory Displays in the Ars Musica Domain. arXiv preprint arXiv:1311.5426.
Walker, B. N., & Cothran, J. T. (2003). Sonification Sandbox: A graphical toolkit for auditory graphs.
Walker, B. N., & Nees, M. A. (2011). Theory of sonification. The sonification handbook, 9-39.
Worrall, D. (2011). An Introduction to Data Sonification. In: Oxford University Press.
Worrall, D., Bylstra, M., Barrass, S., & Dean, R. (2007). SoniPy: The design of an extendable software framework for sonification research and auditory display. Paper presented at the Proc. ICAD.
Worrall, D., Tan, D., & Vanderdonckt, J. (2019). Sonification Design: From Data to Intelligible Soundfields. Cham: Cham: Springer International Publishing.
Zhao, H., Plaisant, C., Shneiderman, B., & Duraiswami, R. (2004). Sonification of Geo-Referenced Data for Auditory Information Seeking: Design Principle and Pilot Study. Paper presented at the ICAD.