Recognizing and Predicting Individual Drumming Groove Styles Using Artificial Neural Networks
Introduction
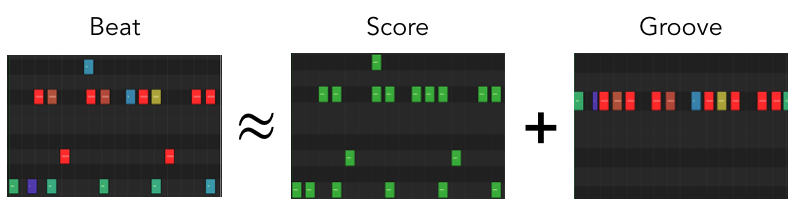
As shown in the picture above, a MIDI drum beat can be divided into two sections: the score, which is the quantized notes that the drummer plays, and the groove, which is how the drummer plays the notes. In this blog post, we’ll be examining groove and attempting repliacte a groove style an individual drummer. First, we have to define what the elements of a groove are.
Background Information
What is Groove?
Groove can be defined as a combination of velocity, which is how hard a note is played, and microtiming, which is how far a note is off of a quantization grid. When microtiming and velocity are applied to a quantized drum score, it creates a sense of humanization for listeners.
Previous Work
In 2019, Google’s Magenta project created GrooVAE, which they define as a “class of models for generating and controlling expressive drum performances” using machine learning. Through this project, they were able to sucessfully apply a realistic, human sounding groove to any drum score.
Data Set
While creating GrooVAE, the team also developed the Groove MIDI Dataset. For this project, we will be using an expanded version of this data set, known as the Expanded Groove MIDI Dataset (E-GMD), which features 444 hours of MIDI data from 9 different drummers.
Project Description
This project design can be broken down into five sections: extracting data from the MIDI database, training a multilayer perceptron (MLP) classifier to recognize a drummer’s unique groove, training MLP regressors to generate microtiming histogram bins based on each drummer’s MIDI velocity while playing, generating MIDI based on the regressor’s output, and testing if the previously trained classifier can recognize the drummers based on the MIDI that was generated.
MIDI Data Extraction
The Python package Mido was used in this project to extract relevant data from MIDI files, which includes the velocity and timing of each note played. Additional features, such as tempo and beat type (beat or fill), were extracted through the name of each file in the E-GMD (ex. “4_latin-brazilian-samba_89_beat_4-4_6.midi”). These features were extracted into a series of classes, including a class for each drummer, MIDI file, and MIDI note.
Training the Classifier and Regressors
Feature Extraction
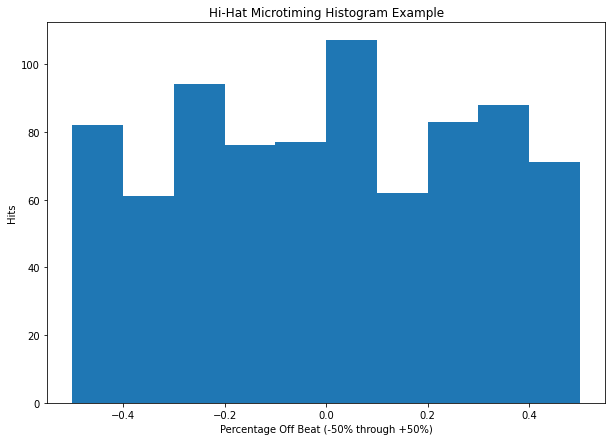
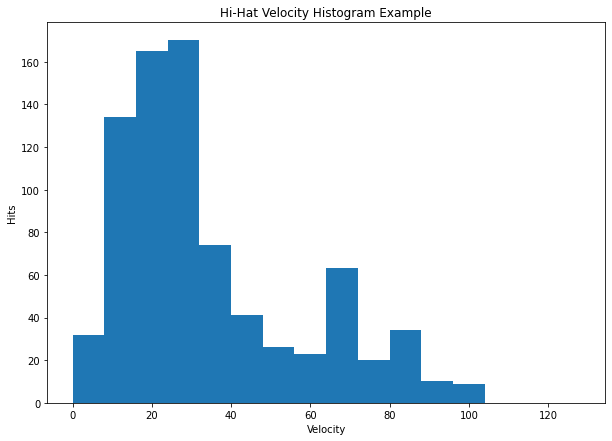
The features that the classifier and regresors use are histogram bins generated by analyzing microtiming and velocity for each snare, bass drum, and hi-hat note of every file. When extracting features, the system iterates through all files for every drummer and place the velocity and the microtiming in their respective histogram bins. The bins for velocity are in increments of 8 on a scale of 0 to 127, corresponding to the velocity value supplied by the MIDI note, resulting in 16 total velocity histogram bins. The microtiming section requires a few more steps to get histogram bins. Since there is no guarantee that the ticks per beat of each file are the same, the values must be normalized. This was accomplished by creating a function that computed the percentage of how far off beat each note was from a perfect sixteenth note using a given tick per beat value. Ostensibly, this function showed how far a note is from a thirty-second note, since the furthest a note can be away from sixteenth note quantization is a thirty-second note. Once we have a percentage ranging from -50 (directly on the thirty-second note behind the sixteenth note) to 50 (directly on the thirty-second note ahead of the sixteenth note), the value is placed into one of 10 histogram bins, each of which corresponds to 10 percent of the quantization percentage range.
Classifier Testing
The features that the classifier is trained on are the microtiming and velocity histogram bin values of each file and target value is the drummer. Once the features are extracted, the classifier is trained and tested with 10 k-folds. Through testing, I found that the classifier could predict a drummer based on these features with 90-97% accuracy.
Regression Testing
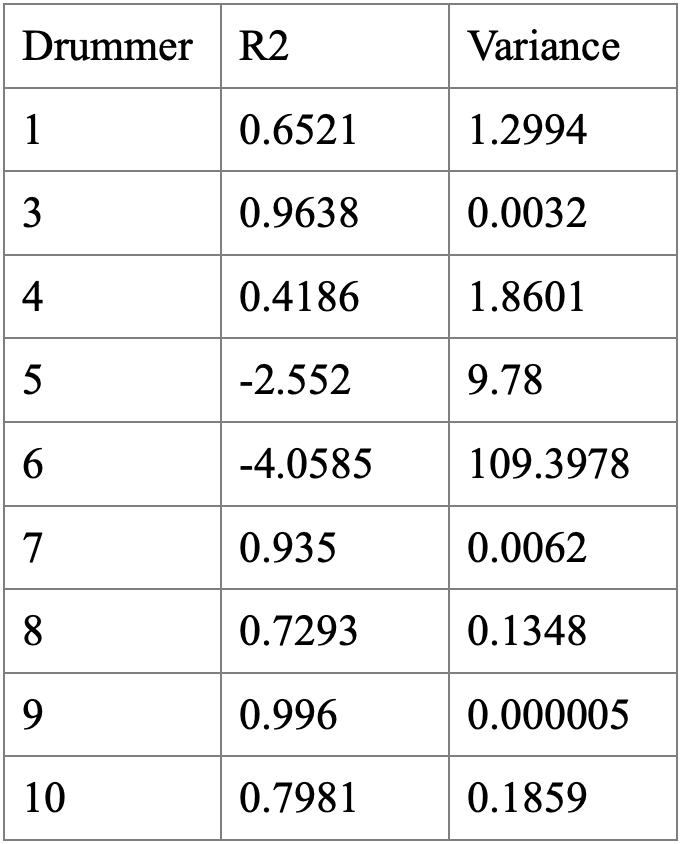
The features that the regressors are trained on are the histogram values for velocity, while the target values that it is trying to predict are the histogram values for microtiming. For each drummer, we will create a new drummer and train and test it with 10 k-folds. The R2 score and varience for each drummer’s regressor can be seen on the table below.
MIDI Generation
As we can see from the table, drummers 3, 7, and 9 had the best results, so from here on out we will only be focusing on these three drummers. To generate MIDI, I used the python package MIDIUtil. The generated MIDI files consist of constant sixteenth notes for the bass drum, hi-hat, and snare to ensure each instrument is equally weighted when evaluated with the classifier in the next step. Each of these notes have a random velocity and microtiming applied to it based upon an array generated using weighted random values based on the microtiming and velocity histogram inputs, which were supplied to us from the regressor. For velocity, each histogram bin percentage is divided by 8 and applied to every velocity value, so that 0 through 127 all have a probability of being selected. The microtiming histogram uses the same system, but there is a probability for every 1 percent off a sixteenth note (from -50 percent to 50 percent) and each histogram value is divided by 10 to accomplish this. These audio files will be used to test with the previously trained classifier. An example audio file for each drummer can be found below.
Drummer 3 Generated MIDI Classifier Input
Drummer 7 Generated MIDI Classifier Input
Drummer 9 Generated MIDI Classifier Input
Testing Generated MIDI Files
After the MIDI files are generated, they are then fed into the previously trained classifier to evaluate if it can accurately classify our generated MIDI files. Unfortunately this ended up not working that well, with accuracy scores around 40-66%.
Final Thoughts
Through testing, we found that an MLP classifier can reliably predict an individual’s drumming groove using microtiming and velocity histogram values alone. However, we also found that only some drummers had accurate R2 scores for MLP regressors predicting microtiming histogram values based on velocity histogram values. When examining the input files for each drummer, the common link between each drummer with good R2 scores was relative consistancy in playing style. For example, drummer 3 played mostly rock beats, with a few jazz and hip hop beats as well, and had excellent R2 scores. Meanwhile, drummer 5 was trained on a significant amount of MIDI files, but due to the diversity of different styles they played, which included samba, blues shuffle, funk, rock, afro cuban jazz, and more, R2 results were significantly lower than other drummers that were trained on the same number of files. Therefore, future studies on individual groove should focus on specific styles of music.
In terms of the generated MIDI files, you can listen to a more “normal” 4/4 beat generated with the same aformentioned techniques below.
Drummer 3 Generated MIDI
Drummer 7 Generated MIDI
Drummer 9 Generated MIDI
As we can see, the MIDI files sound pretty random and there are no distinguishing characteristics between each drummer to the naked ear. Future studies may have to use a windowing function to create more human and less roboting sounding MIDI files.
Files
You can view the GitHub repository with the files for this project here.
Image Sources
https://magenta.tensorflow.org/assets/groovae/score-groove.png
https://i.pinimg.com/originals/b7/db/69/b7db69a654b84e86467d5aa0b28ee35d.jpg