Estimating the repertoire size in birds
Introduction
Unsupervised learning algorithms search for structures or patterns in a dataset without requiring labels. In the context of bird song recognition, this approach can be useful to draw inferences when manual labelling is inaccesible or too expensive. For example, unsupervised learning can be used to find hidden structures in bird songs [1].
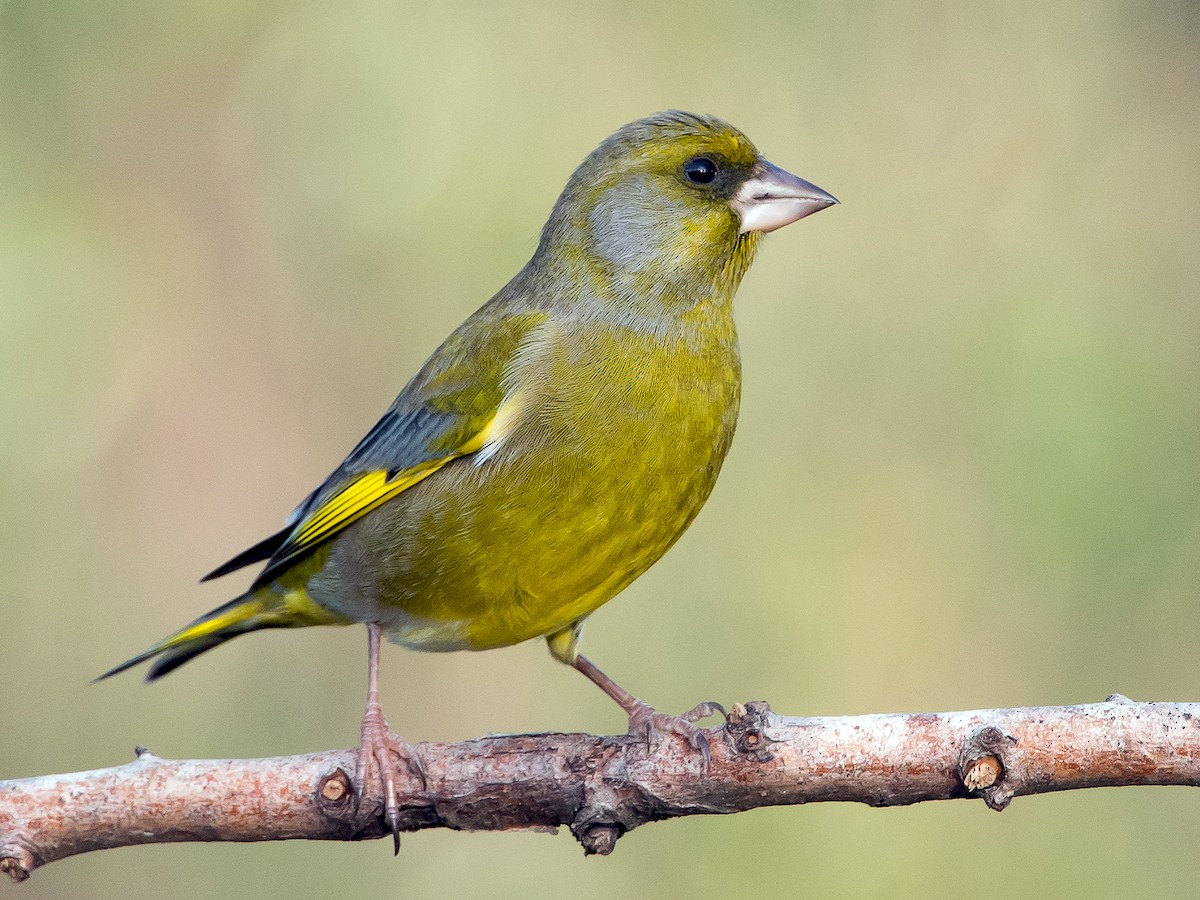
In this blogpost, we will focus on the greenfinch songs (Chloris Chloris). They are organized in a variation of elements which may go on for more than one minute. More precisely, the song of a male greenfinch has been characterized by having groups of tremolos, repetitions of tonal units, nasal chewlee and a buzzing nasal wheeze, which could be uttered on its own and categorized into four phrases classes [2]:
- A trill
- A pure tone
- A nasal tone
- A nasal “tswee”
The goal is to use an unsupervised method to estimate the repertoire size in the greenfinch songs. The proposed method follows five main steps which requires to (i) download audio recordings from an online collaborative database, (ii) segment the audio recordings, (iii) convert them into a reduced representation set called a feature vector, (iv) use t-SNE, a dimensionality reduction algorithm, to reduce the dimensionality of the data [3], and (v) automatically form homogenous groups using the DBSCAN algorithm [4].
Estimating the size of the repertoire
Estimating the size of the repertoire can be a challenging task as it needs to perform syllable classification from audio recordings. Therefore, there are many problems we can encounter:
- Data set issues — the data can be highly imbalanced due to bigger popularity of one species over another, there is a large number of different species and recordings can have different length, quality of recordings (volume, cleanliness)
- Multi-label classification problem — when there are many species singing at the same time
- Background noise — road, rail, and air traffic
- Different types of bird songs - elements, syllables, phrases, calls, and songs
- Inter-species variance — there might be a difference in birdsong between the same species living in different regions or countries
To minimize these problems, we can start by (i) downloading only high quality recordings from the Xeno-Canto database, according to its quality ratings ranging from A (highest quality) to E (lowest quality), and (ii) removing recordings that have an other specie referenced in the background using Xeno-Canto’s Application Programming Interface (API v2) and the following fields of the recording object:
- q: the current quality rating for the recording
- also: an array with the identified background species in the recording
Segmenting
Moreover, to reduce the size of the dataset and facilitate computer processing, we segment the audio recordings into individual syllables. However, the detection of boundaries for the bird syllables is quite challenging because adjacent syllables can overlap in time and frequency and the onset/offset detection can occur below the background noise level.
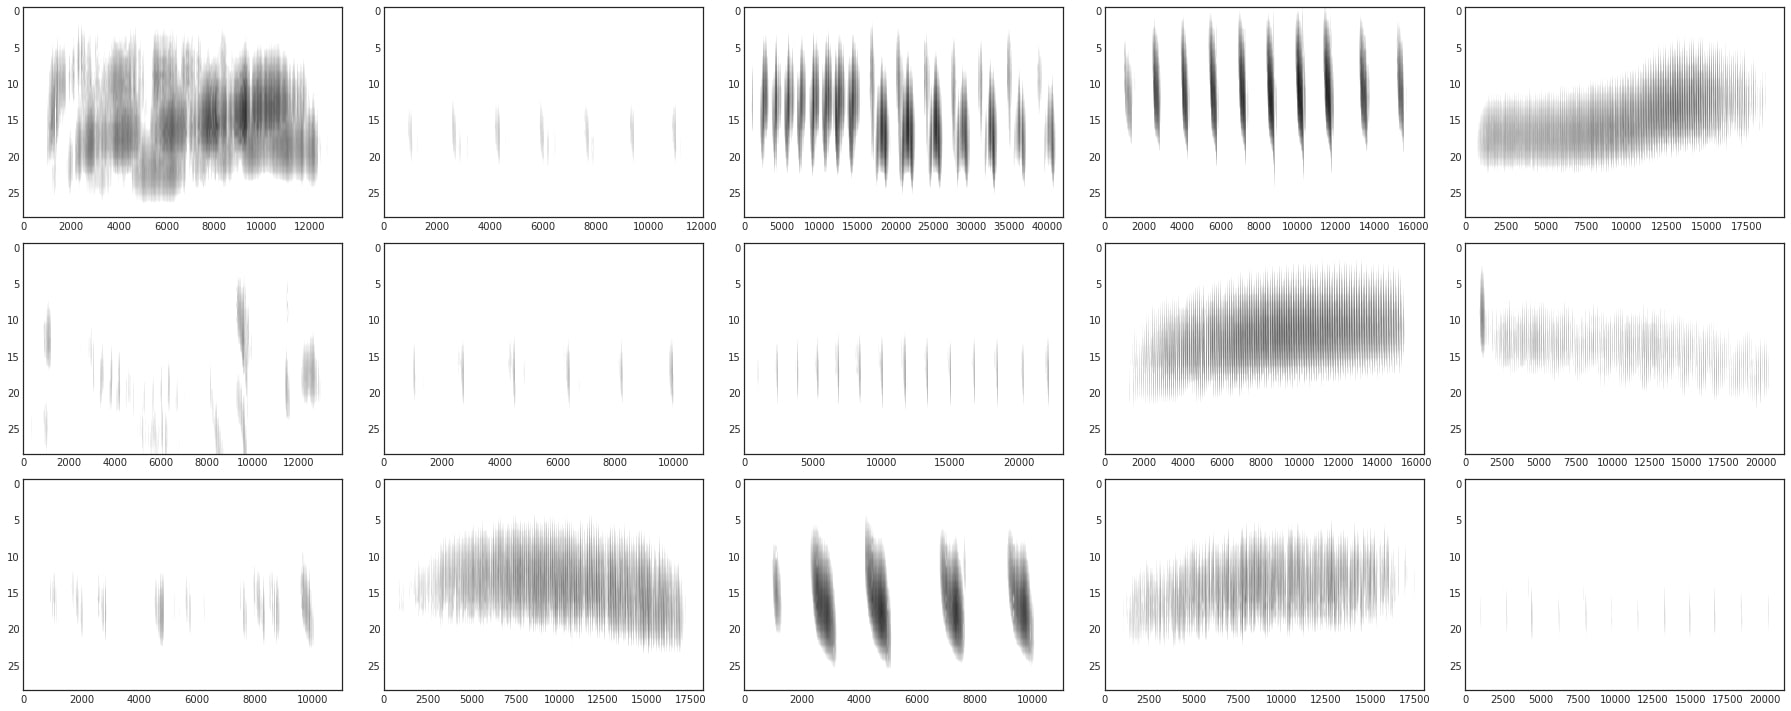
The common approach is to convert audio recordings into a spectrogram and apply image processing techniques to pick out the signal of interest. Here, we use the Wavelet Transform (WT) over the Fourier Transform (FT) as it allows a better temporal resolution and is well adapted for non-stationary signals such as bird songs [5].
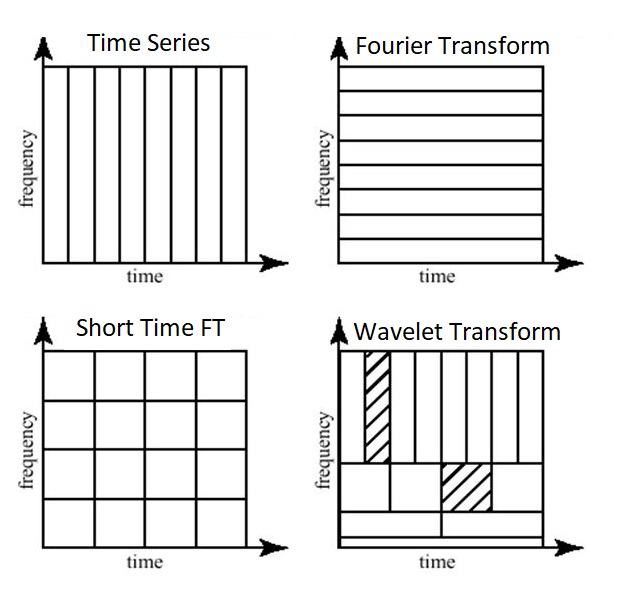
The Fourier transform is mainly used for stationary signals which are represented as a sum of sinusoids, meaning that the standard transform is only localized in frequency. Conversely, wavelets are localized both in time and frequency increasing the performance of our syllables segmentation because we are dealing with non-stationary signals.
Filtering
Furthermore, the WT is also useful to remove background noise as it allows to decompose the signal into details (high) and approximation (low) parts. At some scale, the details contain mostly the insignificant noise and can be filtered or zeroed out using thresholding without affecting the signal [6]. Using the free library for the Python programming language PyWavelets it is quite easy to implement.
def filtering(signal, wavelet='db6'):
    # Calculate decomposition and reconstruction filter values
    dec_lo, dec_hi, rec_lo, rec_hi = pywt.Wavelet(wavelet).filter_bank
    # Apply high-pass decomposition filter along one-dimension
    y = scipy.signal.lfilter(dec_hi, 1, signal)
    return y
Before filtering
After filtering
Extracting
Furthermore, we convert each syllable into a reduced representation set called a feature vector. Since bird sounds are musical in nature, time and frequency-based features used in audio and music retrieval can be extracted. More precisely, we extract Mel-Frequency Cepstral Coefficients (MFCCs) and Descriptive Features (DFs) [7] as they are representative of the way humans hear.
-
Time domain features
Energy (EN)
Zero Crossing Rate (ZCR)
Duration of the Syllable (DUR)
-
Frequency domain features
Spectral Centroid (SC)
Spectral Bandwidth (SB)
Spectral Flux (SF)
Spectral Roll Off (SR)
Spectral Flatness (SF)
Implementing the model
Classification
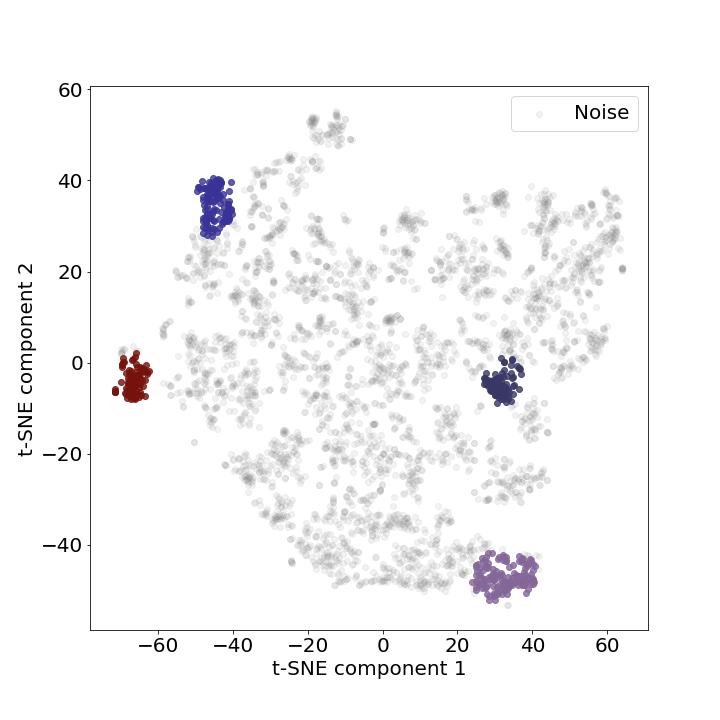
Because we are dealing with high-dimensional feature vector, we facilitate the classification process by applying the non-metric dimensionality reduction technique t-SNE to project the data in two dimensions.
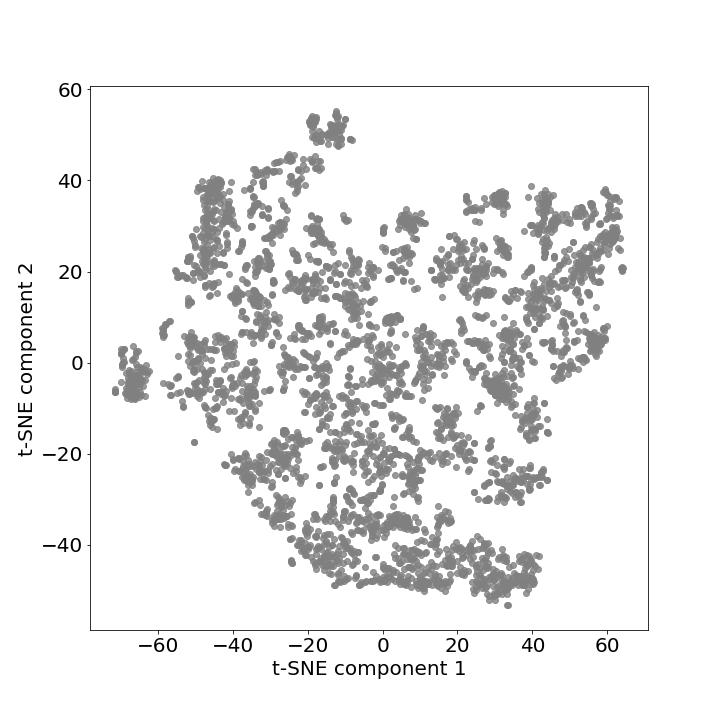
Additionally, we cluster the samples rapidly and objectively using the DBSCAN algorithm. This algorithm is useful to find core samples with high density and expand clusters from them. One of the significant attributes of this algorithm is noise cancellation which is helpful to discard the noisy samples as well as the capacity to find the number of clusters while coping with unbalanced classes.
However, the biggest challenge with the DBSCAN algorithm is to find the right parameters (eps and min_samples values) to model the algorithm. This requires to find the minimum Euclidean distance between each samples and to identify the “knee” point, or the point of maximum curvature of the curve. That way, we can find the optimal eps parameter.
Evaluation
Finally, we evaluate the model through various ranges of min_samples values and find the right value according to the highest Silhouette score. Silhouette score always ranges between -1 to 1 with a high score suggesting that the objects are well matched to their own cluster and poorly matched to their neighborhood clusters. This is computed as follows:
In this study, we iterate over minimum samples values ranging from 20 to 75 and find a maximum Silhouette score of ~0.88 for a minimum sample value of 75. This made it possible to estimate the size of the greenfinch song repertoire at four syllables, corresponding to the previous observations that had been established in [2].
min_samples |
Number of clusters | Silhouette score |
|---|---|---|
| 20 | 4 | -0.177 |
| 25 | 4 | -0.165 |
| 30 | 11 | -0.043 |
| 35 | 15 | 0.131 |
| 40 | 24 | 0.269 |
| 45 | 25 | 0.336 |
| 50 | 27 | 0.491 |
| 55 | 20 | 0.541 |
| 60 | 14 | 0.679 |
| 65 | 11 | 0.734 |
| 70 | 4 | 0.870 |
| 75 | 4 | 0.878 |
Code and instructions for setting up this project can be found here.
References
[1] Ranjard, L., & Ross, H. A. (2008). Unsupervised bird song syllable classification using evolving neural networks. The Journal of the Acoustical Society of America, 123(6), 4358-4368.
[2] Hans R. Güttinger. Variable and Constant Structures in Greenfinch Songs (Chloris chloris) in Different Locations. In: Behaviour 60.3/4 (1977), pp. 304–318.
[3] Maaten, L. van der, & Hinton, G. (2008). Visualizing data using t-SNE. Journal of Machine Learning Research, 9(Nov), 2579–2605.
[4] Ester, M., Kriegel, H.-P., Sander, J., & Xu, X. (1996). A density-based algorithm for discovering clusters in large spatial databases with noise. Proceedings of the 2nd International Conference on Knowledge Discovery and Data Mining, 96(34), 226–231.
[5] LI, J., ZHENG, J. M., WU, Y., & XING, F. (2006). AUDIO SEGMENTATION BASED ON THE WAVELET TRANSFORMATION. In Wavelet Active Media Technology And Information Processing: (In 2 Volumes) (pp. 319-324).
[6] Priyadarshani, N., Marsland, S., Castro, I., & Punchihewa, A. (2016). Birdsong denoising using wavelets. PloS one, 11(1), e0146790.
[7] Arti V Bang and Priti P Rege. Evaluation of various feature sets and feature selection towards automatic recognition of bird species. In: International Journal of Computer Applications in Technology 56.3 (2017), pp. 172–184.