Estimation of Direction of Arrival (DOA) for First Order Ambisonic (FOA) Audio Files
Note: The source code and technical report are available on GitHub
The aim of this project is to estimate the Direction of Arrival (DOA) from a sound event encoded as a First Order Ambisonic (FOA) audio file (4-channel). Basically, we want to know where a sound is coming from just by looking at a raw audio file for 3D sound, which can be solved by humans but still with some imprecision.
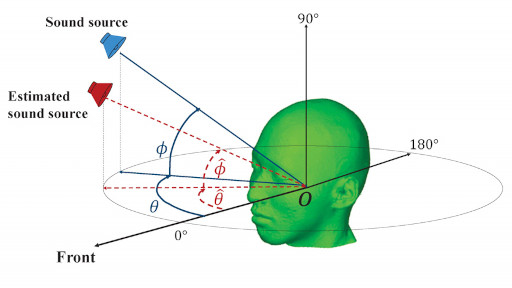
DOA is usually presented as two angles: elevation ϕ, and azimuth θ as shown in the figure below. The sound event is the blue sound source as depicted in the illustration, and the estimated direction is represented as the red source. The goal is to reduce the error between both.

There are methods to calculate this estimation when we have a clean sound source. However, when noise, reverberance, and other artifacts are included in the sound, the task starts to become a difficult problem, which demands more robust methods. In that sense, machine learning techniques are suitable for this challenge.
The Solution
Machine Learning (ML) algorithms need data to learn from. For this project, the journey started with finding a suitable data set to work with. I used the one provided by the Sound Event Localization and Detection Challenge (2019). A full description is provided on the website, but the important aspects regarding this data is that files are combined with noise, reverberance, and half of the set for training and testing purposes are overlapped with up to 2 sounds, which is more challenging for a potential solution. In summary, from this data set we can extract 15798 short FOA sounds for training and 3974 for testing, each file is associated with a localization in space (elevation, azimuth, distance).
The chosen machine learning technique was an Artificial Neural network (ANN) for regression, since the problem require to estimate multiple outputs (elevation, azimuth) that are numerical values in the real domain. The most challenging part before training this ANN was to find the right features for its input.
My first tries for building the features were based on the fact that each channel on the FOA file is different from each other in terms of delay and power. If we think about how humans can detect the direction from a sound source, we can tell that the sound comes first in one ear and then hits the other one with lower volume, additionally the shapes of our hears acts as filters. However, I obtained a really poor accuracy in the prediction.
The second set of attempts were inspired by successful solutions from previous works in which researchers used the spectrogram arranged as features, nevertheless, I did not get good results since the ANN that they employed were Convolutional Neural Networks(CNN) and/or Recurrent Neural Networks(RNN) with custom modifications, I was limited to use a full-connected feed-forward ANN.
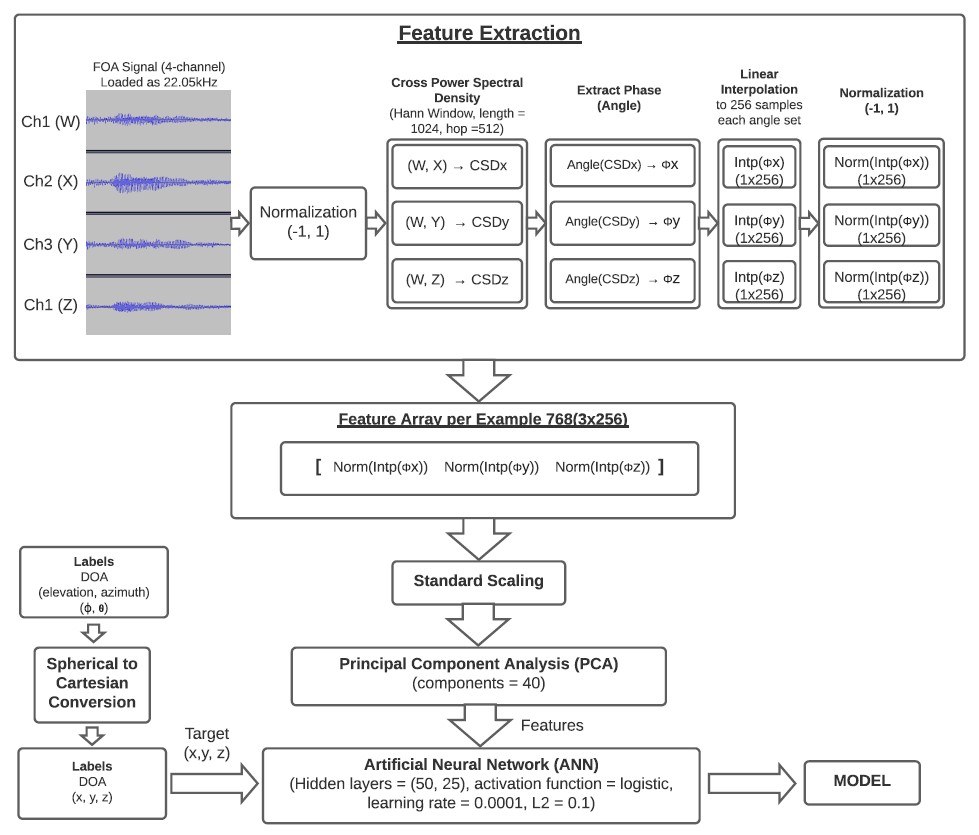
Diving in the literature, I tried the cross-spectral density (CSD) as the key solution for the right features. After a methodic search for the best hyper-parameters for ANN architecture, I ended up with the solution shown below.

As the picture above illustrates, the process for feature extraction was:
- Normalize the audio signals.
- Calculate CSD for three pairs of channels (W, X), (W, Y), (W, Z).
- Extract the phase per each pair.
- Interpolate the arrays to a set of 256 elements each.
- Normalize each interpolated set.
- Join the three arrays in one only feature set.
After this process, a Whitening transformation (standard scaling) was applied to the whole set, then the number of features were reduced to 40 by applying Principal Component Analysis (PCA) since keeping 40 components was suitable for the problem (details in the technical report). Finally, it was provided to the ANN described in the picture above.
Note that the ANN was trained with a label set converted from spherical coordinates to cartesian coordinates, which means that the task became a 3-output regression problem.
Results
The performance metrics for the solution by calculating the error between the actual and predicted value regarding the training set, cross-validation, and testing set are shown in the table below.

For each component (x,y,z), the Coefficient of Determination (R2) is depicted in the next table. It indicates that the algorithm performed better for x and y compared to z.

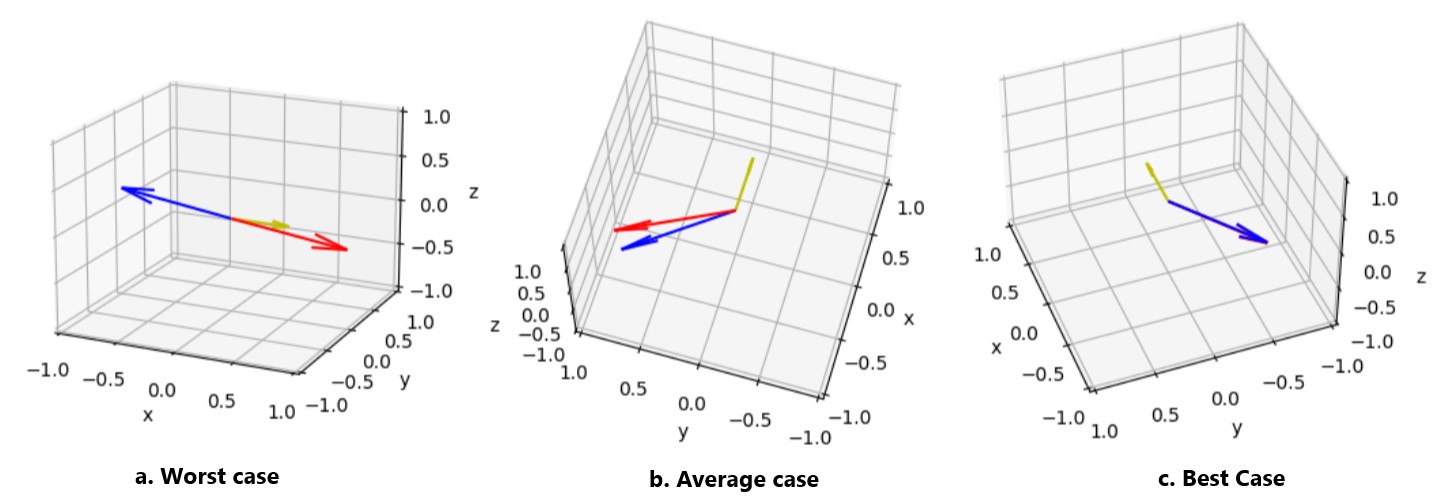
These results shows that we have an error about 30° between the actual direction and the estimated one. The worst (178.34°), average (30.24°), and best (0.49°) case from the testing set are illustrated in the following picture. The yellow vector is the reference (front), the blue is the actual DOA, and the red vector the estimated one.

Reflection
The estimation of DOA is a complex task that have been solved with Deep Learning strategies, which were out of the scope for the requirements of this project. In those cases, for the same data set the best solution has an angle error of approximately 4.75° for the training set. The solution presented here has around 30°, which is acceptable for applications that does not require high precision, for example, to control visual feedback for 3D sound files.
The most challenging part was to figure out the right features. It is important in machine learning (ML) applications to have a handle of expertise regarding the characteristics of the data for achieving the highest accuracy possible. Then, some experimentation regarding the architecture for ML algorithms is required to improve the results, which can sometimes have some support, but in others could be hard to explain.
I hope this work gives lights to build up an understanding of the process for DOA from a ML perspective.
The source code and technical report are available on GitHub
