[ Music Mood Classifrustration ]
[ Overview ]
This is a first experimentation with music mood classification by getting familiarity with basic Machine Learning algorithms and Librosa. The conceptualization of this project came from a personal motivation of connecting music technology to music therapy. A first step into the direction of creating an application for machine recognition of music emotion and classification. This is also a starting point to a future project which attempts to be an application able to identify the user’s mood and predict variations, suggesting music accordingly to the actual mental state and particular profile of that user.
Music and emotion are concepts deeply connected to human experience. Hence music is known for its capability to change the mood of the listener and drive feelings. Thereby, Machine Learning turns to be an efficient tool for recognizing human emotions in music, which can be useful when it comes to the selection and suggestion of music for specific user’s needs amongst the enormous amount of music data digitally available.
Here I will describe a frustrated attempt of using Machine Learning for the music emotion recognition, exploring techniques, tools and experiments within a combination of audio features to reach the best performance possible due the size of my dataset and available time to work on it.
[ Emotion ]
The challenges concerning the recognition of music emotion are peculiarly complex since the definition of emotion is not unanimous regarding categories and models to be used. The main question, in this case, is how to conceptualize emotion and its taxonomy.
A common procedure to MER is training a classifier to identify emotions in a few classes related to primary human feelings as happy, angry, sad, and relaxed. Frequently, supervised learning algorithms such as Support Vector Machines, are adopted to improve the machine acknowledgment of the correlation among music features (timbre, rhythm, and harmony) and emotion.
Yang and Chen indicate three approaches for MER. The categorical approach uses supervised learning to train a classifier with predicted labels to categorize emotions into discrete classes. The dimensional approach, which is a regression model trained to identify numerical emotion values in an emotion space, based on dimensions such as valence x arousal. The third approach is a music emotion variation detection (MEVD), which dynamically predicts emotion in sections of a song, making it possible to trace the emotion of a song within a continuous variation in time.
The perception of emotion on music is typically related to a combination of acoustic attributes. Tempo, pitch, loudness, and timbre can be linked to arousal, while mode and harmony are usually related to valence. Emotion is subjective to individual experiences and it can be an issue for the machine to interpret it adequately. With this in mind, I selected four types of sentiments labeled as: Melancholic, Calm, Uplifting, and Aggressive.
See the 2D Valence-Arousal emotion space (Russell, 1980):
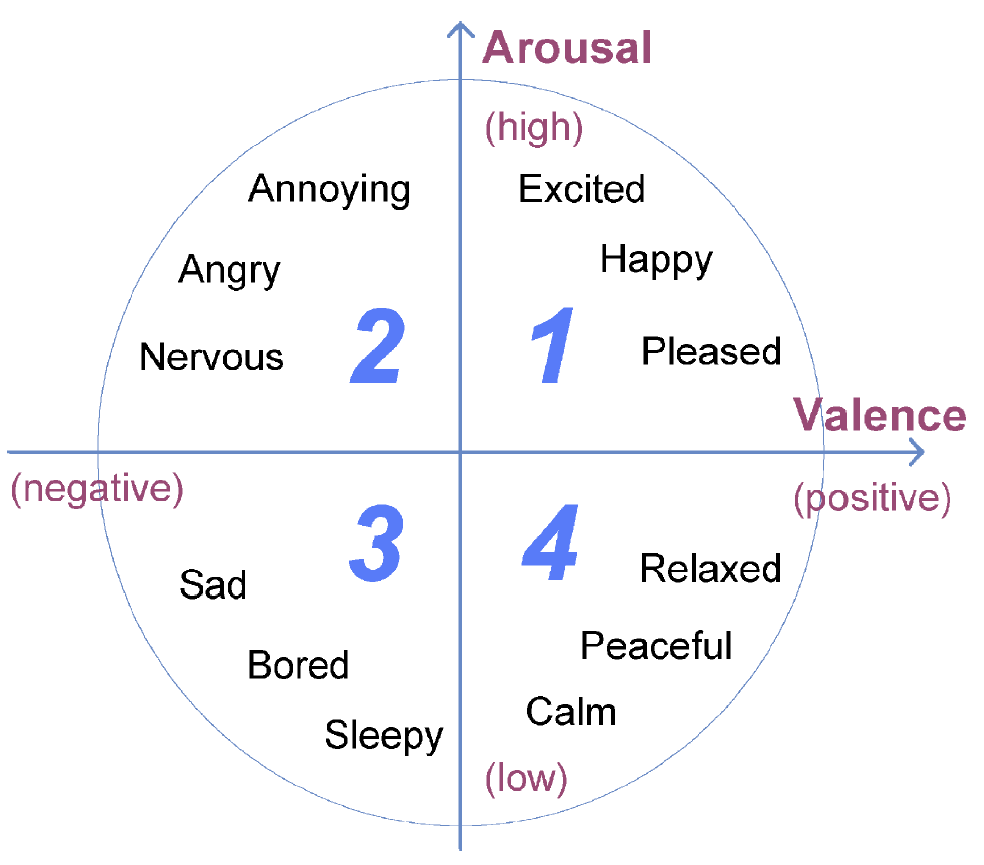
This categorization makes a 4-plane mood categorization, in a 2 dimensional valence-arousal graph. At the horizontal dimensional we have Valence divided in negative to the left and positive to the right, and Arousal on the vertical dimensional, divided by low on the bottom and high on the top.
In this way:
- Melancholic = Low Arousal / Negative Valence
- Calm = Low Aurosal / Positive Valence
- Uplifting = High Aurosal / Positive Valence
- Agressive = High Aurosal / Negative Valence
[ Data Set ]
The data set used for training and classification was the FMA: A Dataset For Music Analysis, from Github.
The FMA has 917 GiB of Creative Commons-licensed audio from 106,574 tracks of 16,341 artists and 14,854 albums. It provides full-length and high-quality audio, pre-computed features, together with track and user metadata, tags, and free-form text such as biographies.
For this project I used small fraction of this data set, which is listed at the download page as “fma-small.zip”:
It contains 8,000 tracks of 30 seconds. From this file, 400 tracks were selected, being 100 tracks addressed for each of the four categories. The collection of songs were tagged with the type of emotion that they convey. The pre-computed features were not used to this project, since one of the goals was to compare different combinations of feature extraction to find the best accuracy specific for the task.
[ Features ]
The perception of emotion on music is typically related to a combination of acoustic attributes. Tempo, pitch, loudness, and timbre can be linked to arousal, while mode and harmony are usually related to valence.
432 features were extracted from the audio files. The feature extraction methods were selected based on the characteristics of each pre-determined category. For instance, “Calm” and “Melancholic” can be very similar in tempo and energy, but differentiate on harmonic and melodic content.
The same happens to “Uplifting” and “Aggressive”, where they have similar overall energy, but different tempo, tonal content, timbre, and dynamic.
During the evaluation of the impact that each feature extraction caused on the system efficacy, it was possible to observe that some features did not add much on the accuracy score but contributed to the consistency of the results between several training with distinct data split and random state numbers (repeated k-Fold Cross Validation).
- Chroma Features
Music Information Retrieval: Chroma
Chroma-based features are efficient for analyzing music whose pitches can be meaningful for the categorization. They extract harmonic and melodic attributes of audio, being consistent to changes in timbre and instrumentation, and having a close correlation to harmony.
- Chroma Constant-Q
A chroma vector indicates how much energy of each pitch class is present in the signal. The constant Q transform can be used for automatic recognition of musical keys based on accumulated chroma content. As it correlates with harmony attributes, chroma was utilized to distinguish between Melancholic and Calm songs.
- Tonnetz
Detecting harmonic change in musical audio
Experiments show that Tonnetz can successfully detect harmonic changes such as chord boundaries in musical audio.
This way, Tonnetz was utilized to help distinguish between audio samples with rhythmical similarity and similar energy also with special focus on separating the categories Melancholic and Calm.
- Tempogram
Music Information Retrieval: Tempo Estimation
Tempogram indicates the prevalence of certain tempi at each moment in time, developed to characterize tempo variation and local pulse in the audio signal.
This feature was chosen to identify clear differenced between high tempo songs and soft songs, which can be useful for classifying correctly Aggressive and Uplifting songs against Melancholic and Calm samples.
- Spectral Contrast
For most music, the strong spectral peaks roughly correspond with harmonic components; while non-harmonic components, or noises, often appear at spectral valleys. Precious studies show that spectral Contrast provide a good discrimination in music type classification, performing better than MFCC for the task. The Aggressive songs of this data generally show a lot of power on the high frequencies and noisy audio. For that reason, Spectral Contrast was included in the features combination.
- Zero Crossing Rate
The zero-crossing rate is the rate at which the signal changes from positive to zero to negative or from negative to zero to positive, which turns to be useful to classify percussive sounds. Also, it can be used as a simple indicator of noisiness. As most of the songs at the Aggressive category are under heavy metal genre or have similar characteristics when it comes to noisy content, distortion and fast percussive sounds, this feature was useful to discriminate this category against the others, having higher zero crossing values than calm songs.
- RMS
RMS has as result a value that makes an effective representation of the power of the signal. Also interesting to use for the same reason as the feature mentioned above, including a more clear classification of Uplifting songs.
[ Implementation ]
Right in the beginning, on the feature extraction step, it was important to observe that some of the features extracted needed to have the values in time preserved, which means that features such as Tempogram get useless when the mean is calculated, due to its strong correlation with the dynamic changes in time. Features such as RMS had the calculated mean.
This way, the data frame regarding the features created a table of 432 columns of features, excluding the labels and names. Also for this reason, the labels of the features couldn’t be indicated in the columns of the table, resulting in numbers indicating each column instead.
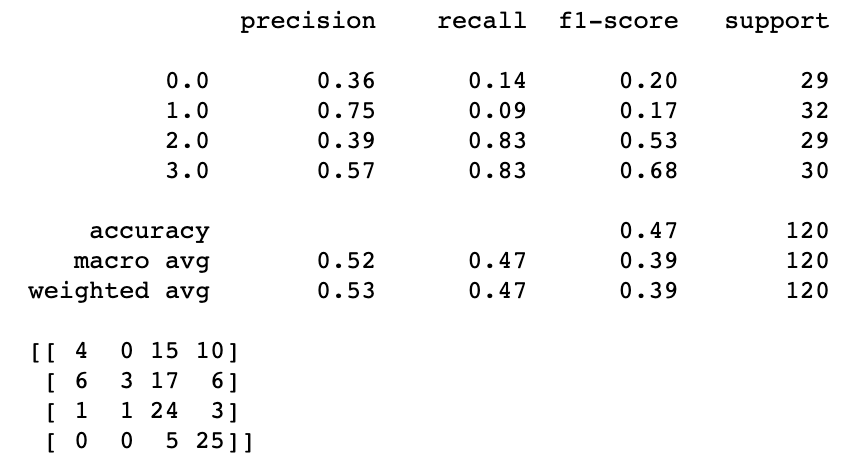
After scaling the features and merging everything into one data segment, the table was reconfigured to present only numbers. For the training step a repeated k-Fold Cross-Validation for Model Evaluation was used with 10 folds and a 70/30 split, having 280 examples for the training set and 120 for the testing set. The accuracy average was 0.41, varying between around 0.35 and 0.45 between the repeated training.
[ Evaluation ]
At first the system was trained and tested with a smaller data set, which was 40 songs per class, and it was showing better accuracy scores, but also when the random state was changed, it could vary from high scores to very low scores, showing inconsistent results each time that the model was trained and tested again.
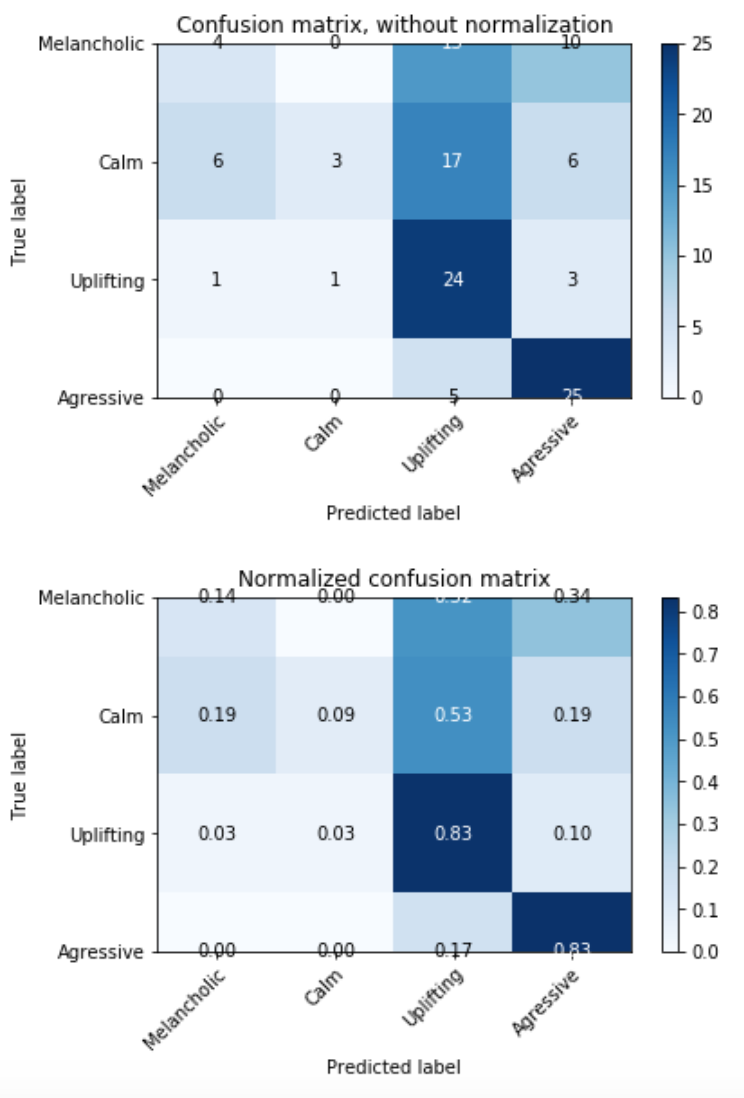
After increasing the data set, the accuracy results were more consistent, not varying as much, but surprisingly, the classification of Melancholic and Calm became much worse than before, when it was classifying Calm songs correctly but misunderstanding the differences between Melancholic and Calm songs, classifying many Melancholic songs as Calm. It is reasonably comprehensive, since the two categories are very related for some similarities on the audio features. After increasing the data set, these two categories turned to be very badly classified, but the Uplifting and Aggressive songs kept the good results.
Conclusions
It was a very important experience to understand the issues of classifying such sensitive characteristics as emotional content by automatizing a system that can distinguish subtle differences on human perception of emotion.
The system proved to be accurate classifying Uplifting and Aggressive songs, but inefficient when it comes to Calm and Melancholic categories. It can indicate that the features and machine learning techniques used were suitable for the identification of tempo, percussive dynamics and energy, but not as efficient to distinguish melodic and harmonic content.
Also, it is possible to see correlations between the features and that this system could have being split in two sections, one dedicated to classify arousal and the other for valence. The data set size has to be taking in consideration as well, a bigger data set would supply more data material for the system to be trained and provide consistent results.
Furthermore, future solutions could involve choosing a different approach for the categorization of the emotions, excluding emotion labels as the ones used in this project, but instead considering the continuous distribution of the songs amongst the negative and positive valence and arousal values.