Group C Learns to Think about how Machines Learn to Think
Machine Learning, a (very) brief primer
Our final module in MCT4000 was in Machine Learning. ML is a sub-discipline of Artificial Intelligence.
ML can be described this way:
“A computer program is said to learn from experience E with respect to some task T and some performance measure P, if its performance on T, as measured by P, improves with experience E.” - Tom Mitchell
There were several ways we explored this formula. The first was via a program designed by Rebecca Fiebrink called the Wekinator. More on this later, but basically, the Wek is a supervised machine learning program. It uses a polynomial regression algorithm (among others) to train itself to infer outputs from unknown data inputs, by using explicitly-mapped examples as training data.
Next up in the toolkit is Scikit Learn. Scikit is a free Python machine-learning library that contains numerous classification, regression, and clustering algorithms for testing data.
With this program, we were able to implement a neural network to train a ML algorithm to classify data into four sets, or classes. Data was compiled by the group and consisted of sound files in four classes: Cats, birds, handclaps, and guns(!). Would the algorithm be able to distinguish between these sounds? As we discovered, sometimes it’s not that easy…
Machine Learning with Wekinator
On the last day of the ML workshop, we had to perform with our Wekinator programs. We’ve all decided to use the same input and output to compare how different each of our programs work after we did some recordings with Wekinator. We decided as a group that all of us will use the XY cursor input into an FM synthesizer through Wekinator.
One of the observations we noticed is that despite the XY value being linear, the machine learning done would be far from it. As we were using basically a two dimensional, two axis graph, we were using the regression method. In the picture below, we see that after plotting just three initial points that the graph starts to non-linearly flatten out at the end without any recorded points.
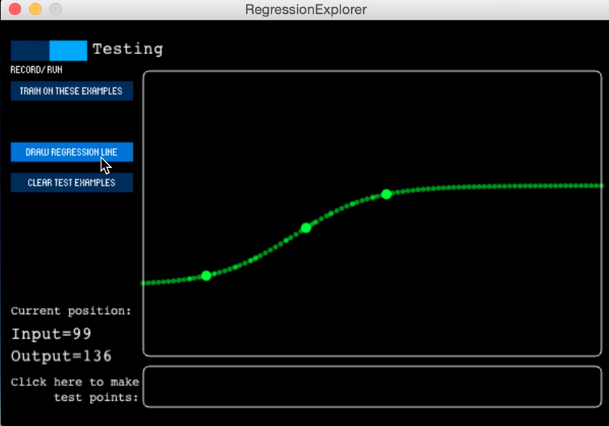
Which leads on to our next observation of the training of the program. Our team member, Tom (Iggy), tried plotting three points with the left and right of the bottom of the Y axis changing pitch and the top right changing the filter. However the machine couldn’t logically presume that he wanted the top left hand corner of the screen to filter the lowest pitch from the initial plots.
After plotting more points, we could use the XY plot to have linear and nonlinear curves to adjust our different parameters to allow for more expression.
Overall its been a great learning experience understand how regression works with Wekinator
Training a classifier with Sci-kit learn
On day 3 of our ML workshop, we got introduced to a python library called Sci-kit learn. Our task was to collect and use a set of labeled data with a specific program in Sci-kit learn to train two classifiers with supervised techniques. The goal was to build highly accurate classifiers and reflect on why certain configurations generated these levels of accuracy.
The data sets consisted of 4 classes with a total of 200 audio files. Our first training set had examples of cats, guns, birds, and handclaps, while the other featured modular synth-shots, orchestral, nature, and bird sounds. As shown in images below, the complete training procedure resulted in two models with an average classifier accuracy of eighty percent.
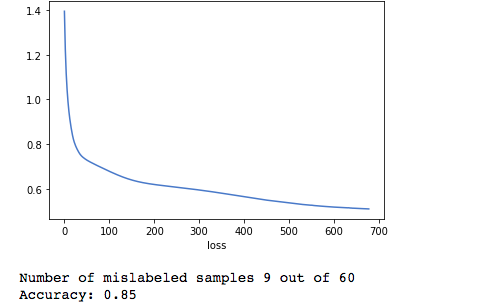

Much to our surprise, it was much harder to achieve higher accuracy with the first training set then with the second. It seems that audio with similar frequency density and sonic characteristics are more demanding to classify. The findings, therefore, indicate that a diversity of labeled data can be beneficial when using these techniques and tools. This provided insight into the possible structural limitations of our program as well as knowledge about the connection between accurate machine learning classifiers and training procedures.