Developing for Muzziball
Introduction
For our MCT Applied Project we have worked on several proof-of-concept development solutions for Muzziball™, an exciting interactive ball which is currently in the development and prototype phase. The prototype of the Muzziball platform is based around a Raspberry Pi and a SenseHat cape inside of a 3D printed sphere. The intention for the platform is to elicit movement from the user by having music and audio react to motion in real time. In order to explore further potential functionality and to provide short-to-medium term solutions for future rounds of prototypes, our team took on several areas of development for this platform, all of which are discussed below.
Integrated Speaker Solution
The project partners specified that for future iterations of the prototype they wanted a unified solution for powering the Raspberry Pi and speakers. The original arrangement consisted of a power bank, the RPi and a bluetooth speaker. We quickly came to the conclusion that designing and implementing an explicit and safe power circuit is above our skill level, so we focused on a power bank solution. After a period of research and exploration we found the following solution.
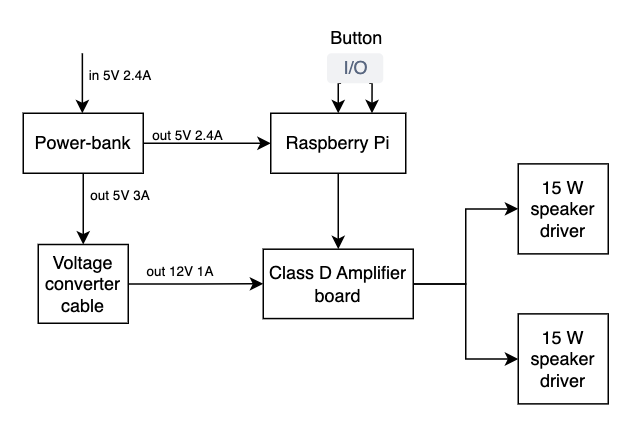
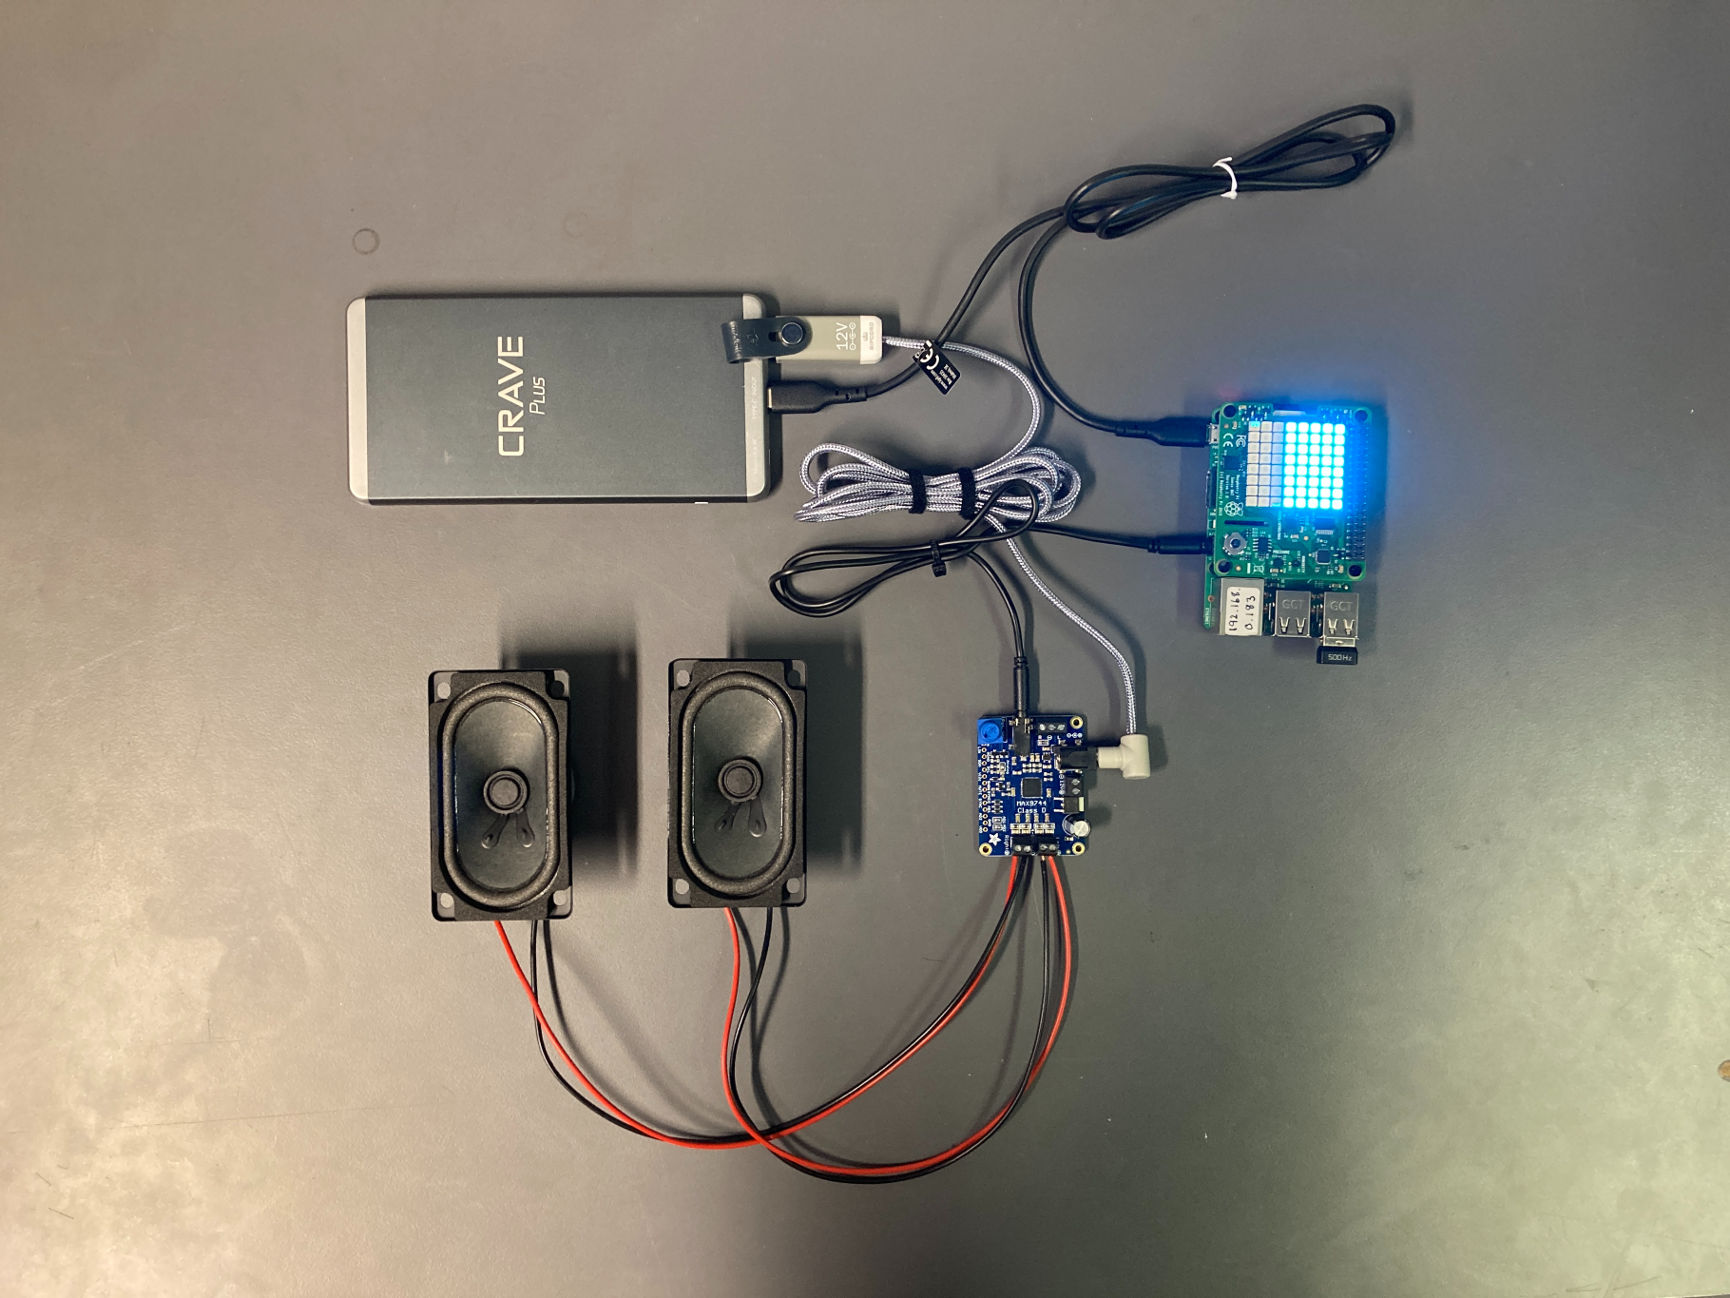
We also tested three different kinds of speaker drivers. The largest-diameter speaker driver produced the best clarity as well as bass response comparable to the existing bluetooth speaker.
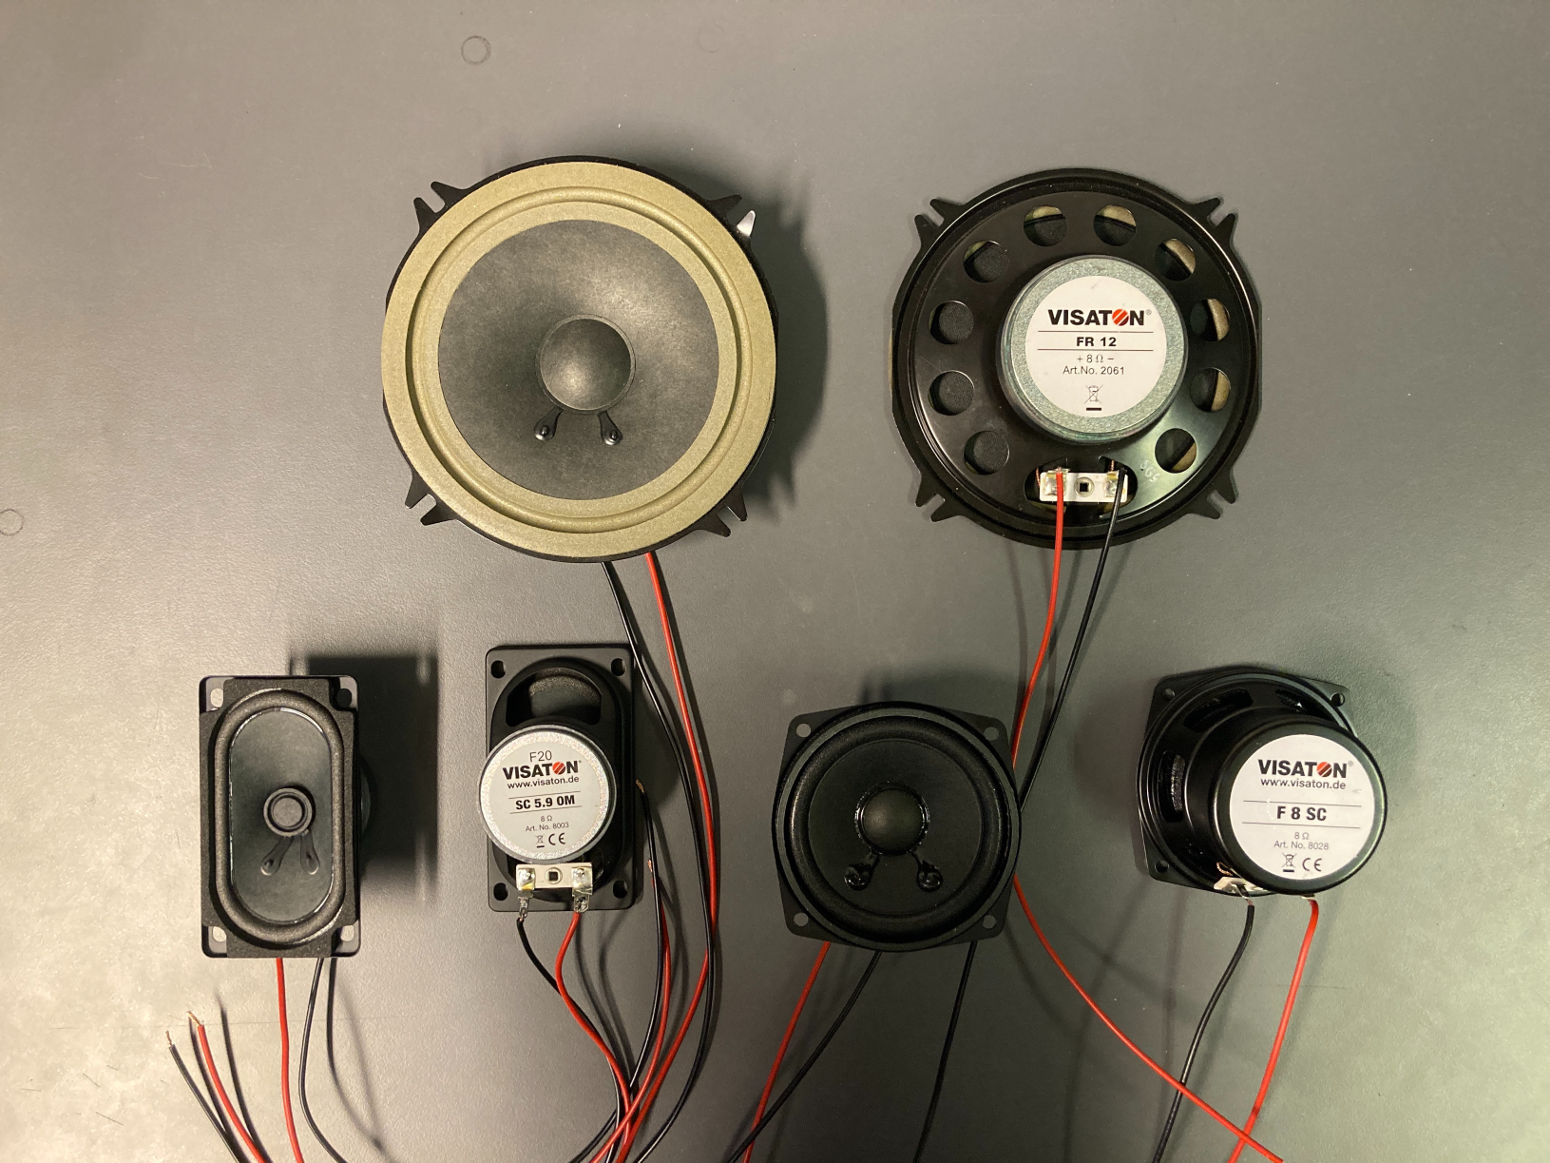
All tested hardware arrangements provide a significant increase in sound quality and clarity without compromising too much in the low-end, thanks to the class D amplifier board and high-quality speaker drivers. With the new power bank, the system can run twice as long.
LED Mapping
The product included an array of RGB LED lights as part of the SenseHat on the Raspberry Pi. Some functionality, such as colour changing, was already implemented to make use of these lights. However, we identified an opportunity for creating other mappings while also building a more robust and flexible interface for controlling them.
We therefore created an API in Python for handling the behaviour of the LEDs. This allows users to change light modes by calling a simple function, and then have the lights change over time. Our new API also adds motion-reactive lights, allowing the lights to change colour depending on how much the ball is moving.
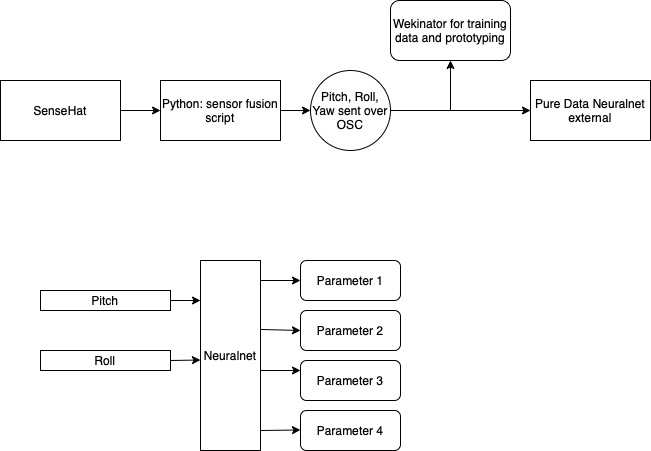
Mapping Motion Data with ML
We worked to implement new possibilities of mapping the motion data using machine learning. In exploring solutions, we used two machine learning packages, Rebecca Fiebrink’s Wekinator and the Neuralnet external for Pure Data.
We decided to take orientation as our input data as we felt this was underused in the current implementation. The SenseHat API allows access to accelerometer, gyroscope and magnetometer data streams. In order to calculate real-time orientation we used a sensor fusion algorithm from the micropython-IMU repository micropython-fusion on Github.
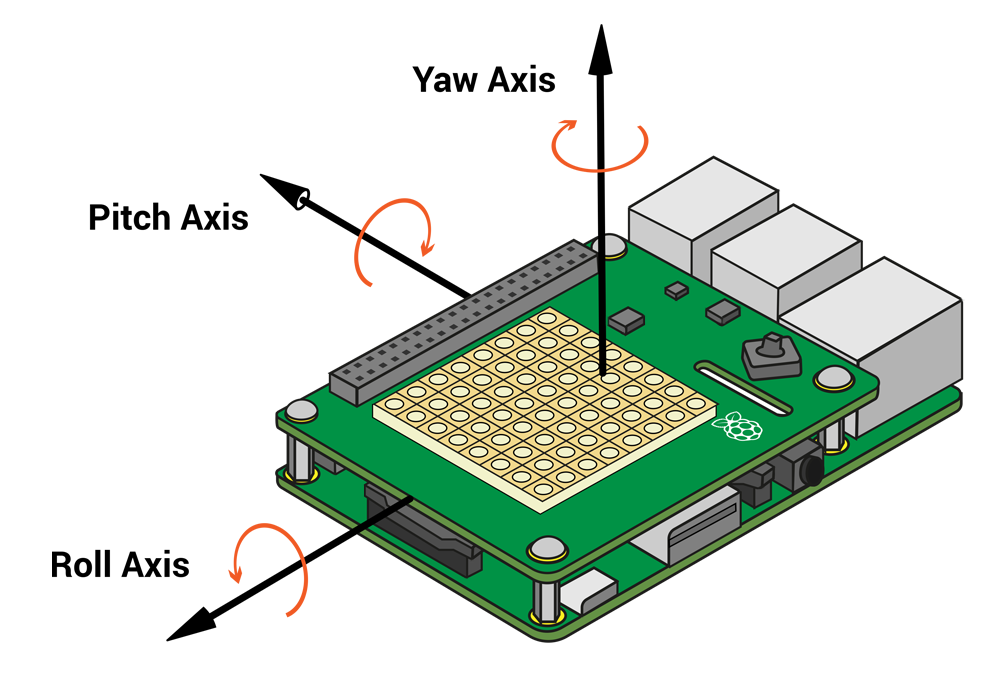
We focused on using a regression ML model to map two motion inputs (pitch and roll) to four outputs. Using the regression model allowed for a smooth transition between orientation states and greater potential for musical mappings. We created 4 new presets to showcase the model:
- Sine tones with evolving chords
- Sawtooth waves through analogue-style filters
- Choir - the four output values from the model control the volume of five choir samples.
- Disco - the four output values control the volume of four different layered disco samples.
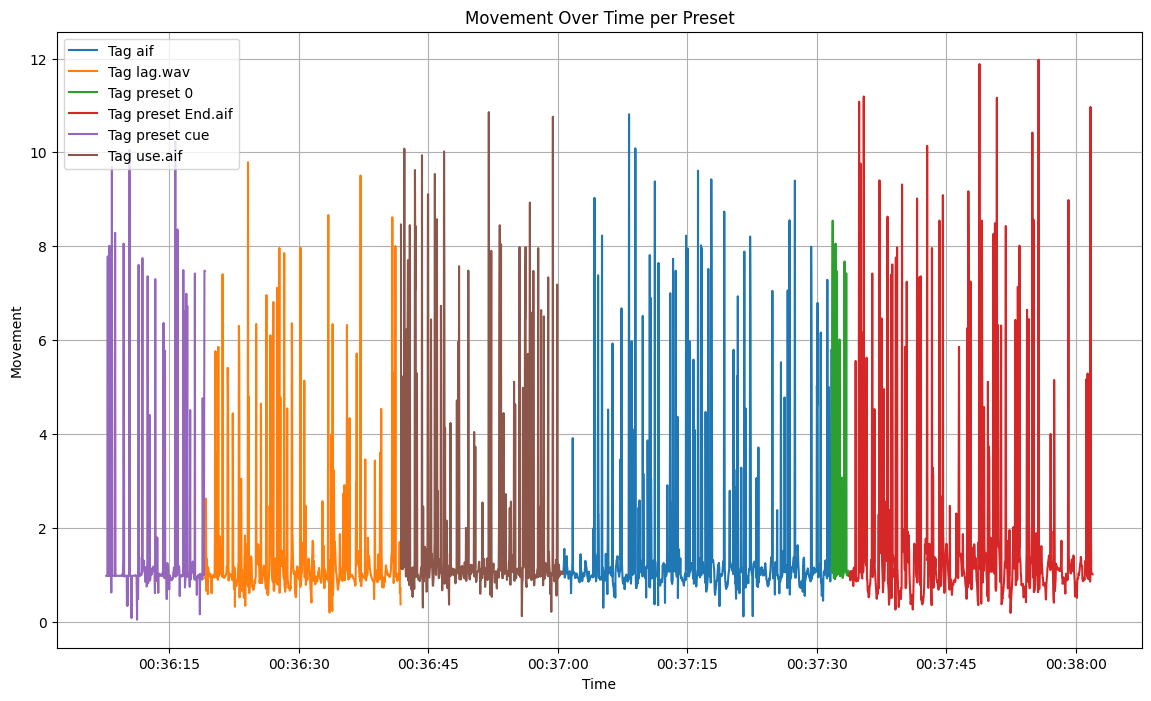
Offline Motion Data Analysis
We aimed to provide tools to illustrate movement data and how it related to other controls in the system. This meant obtaining and storing the motion data as well as creating a “tag” system. Here, tags refer to each user created preset and therefore the type of audio being played.
The acceleration data is stored as time series together with the tag information. The tag information was collected by Python using the “socket” library. The tag was built in a way that it could be sent from different places in the system and present different control data. It can therefore be used for other purposes later. This data is then stored in a csv file locally on the Raspberry Pi.
Analysis was then done in a Jupyter Notebook, reading the csv file and displaying plots to show movement data over time per tag. The acceleration at different axes was difficult to understand so we used magnitude of those three axes as the parameter to show the movement amount. As a result, the partners now have the tools to pick a time range and a tag and understand the movement elicited over this time.
Conclusion
Our intention throughout this project has been to offer potential solutions to the project partner which they can use for future iterations of the product if they wish to do so. To that end we have been able to successfully implement our solutions, and we look forward to seeing where Muzziball goes in the future.