Trippi BySykkel Sounds
Background
In the context of the MCT Applied Project 2, our group collaborated with the external partner Urban Sharing, a company that promotes sustainable micro mobility models through its daughter companies Oslo and Trondheim Bysykkel. The project involves the use of open data from Bysykkel users to make an interactive sound experience for public display. Intended as a web-audio application for online composition for users of Bysykkel in Oslo and Trondheim, we developed a simple prototype of sonification. As composers, music technologists and programmers we approached the task from a less data scientific perspective. From the beginning we were interested in the artistic possibilities to work with large amount of public data in a multi-disciplinary design process. The goal was to portray user data into a sonified, interactive display by making use of public space and public data.
Division of Labour
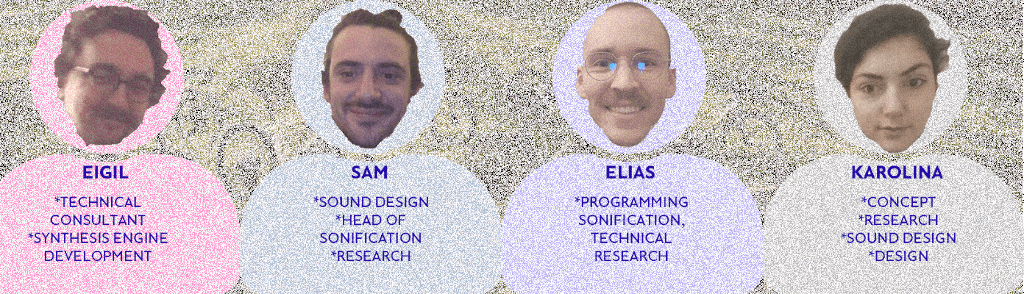
We were all working together on the development process however, we were able to recall each of our areas of expertise.
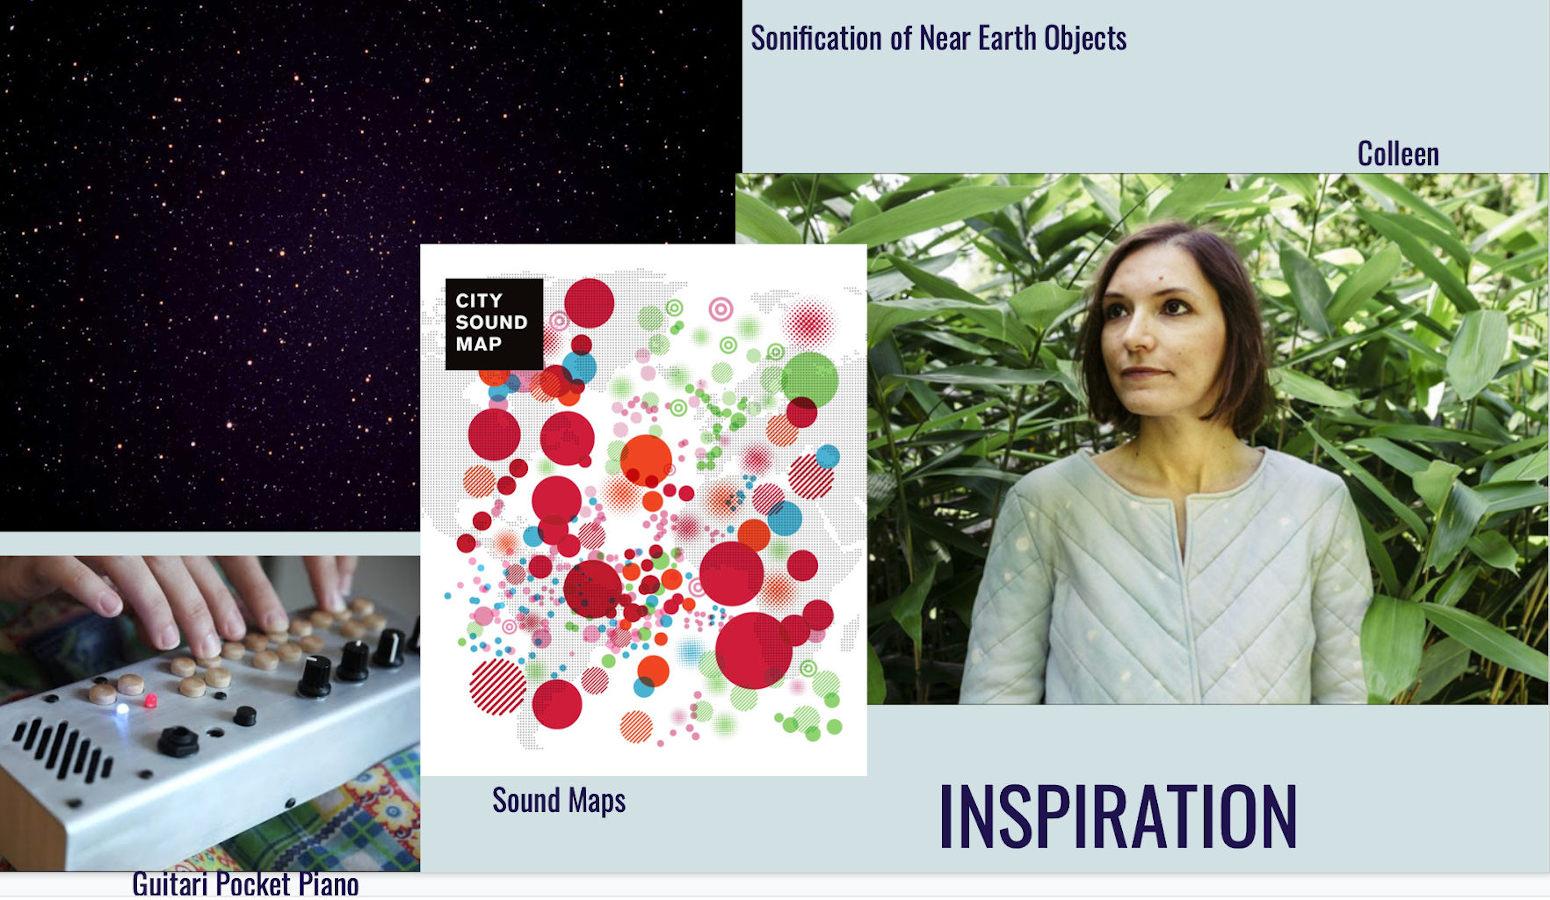
Inspiration
For the concept and sound design approach Karolina was researching in different musical but also theoretical spheres. The sounds chosen for the mapping were then to a large extent inspired by the artist Colleen. Her playful, dreamy Art-Pop gives a light, but not shallow musical sound experience to the Bysykkel trips. But also were the ambient sound of different seasons during the year in combination with the sounds of different day times giving inspiration. On a conceptual level Samuel Thullin has been guiding us with his visions on sound maps (Cartophony) through the project. They are resonating not only in terms of the soundmap features, but also in terms of collective empowerment. The data that has been collected on the Bysykkel users goes back to the public and can explored and comprehended in a playful way. With the soundmap as we imagined it, users are part of reshaping the idea of a non-cartographic mapping process. Micro Mobility as an interaction model for electronic music making could create Acoustic communities (Thulin, 2016) in which authors and users are co-producing their sounds. In doing so it could be a great tool to raise data awareness through an aesthetical, pleasant interactive sound experience.
Data Awareness - The city bike trips as a sonic interface
Sound maps appeared to be a good solution for combining sonification and visuals, becoming one display. The soundmap is a relatively recent invention, having emerged at the intersection of soundscape studies, acoustic ecology, and sound art practices in the late 1990s (Ceraso, 2010). Usually they are geographic collections of distinct “sonic inscriptions” (Thulin, 2016). We were using this idea when allocating the sound design to bike trip parameters.
Data inspired music or parametric sonification? Possible Research Questions
To what extent can the prototype play with patterns, commonalities and casualties that lie in the data? Can our model of soundmap/cartophonic model portray or even affect micro mobility?
Sound Design
In charge of the audio design, Sam created the primary sounds using Ableton Live.
The audio was all created in Omnisphere by spectrasonics. This tool is a very powerful synth that can easily stack both samples and synthesis in layers, often used for cinematic sound design. It seemed fitting for the task. When discussing the style and design of sound inspiration was drawn especially from Colleen, drawn to the complex but aesthetically pleasant, bright and modern sound. Three sounds were created, with three variants of acoustic tones to supplement different periods of the day. Here is a more in depth description of each:
1. Morning
Layer 1
The primary layer is a contemporary marimba sound, recorded from sample and included in Omnisphere’s soundbank. It has a light, bright modern feel with a clean timbre, and has a dynamic, short duration - acting as the lead of the sound
non resonant low pass filter taking out the unneeded sub frequencies around 700hrz
an 1/8th note hi passed delay with modest feedback is added at 40% wet. This creates a more ereathal sound that will last over time
A tape slammer, that warms and slightly affects tone and reduces dynamics
Layer 2
Second layer was originally created on a Kawai K-5000 hardware synth, is a soundscape with a ‘tube’ like sounding timbre. It is more legato in nature, and sits underneath the marimba sound at the same note, thickening the overall sound
Layer 3
Third layer is subtle. It is a stock ‘pop female ahh’ sound that comes in when the note has been held for 6 seconds. This was added to keep the sound evolving when the note has been held, and keep the timbre interesting.
Fully wet, slow chorus is added to this layer for taste
Data Inspired Music Model, Sunday 7am:
Data Inspired Music Model, Monday 7am
2. Daytime
Layer 1
Primary layer is a metallic sound with a music box feel with a strong attack, short decay.
Has a very light reverb at 2% wet to soften slightly, with a little pre delay to avoid dampening the attack
I feel this resonant, bright and short sound signifies the awareness and bright feel of the daytime, where the city is alert, positive and moving.
Layer 2&3
It has been layered with the same 2 layers (the ‘tube’ and ‘pop female ooh’ to thicken the sound again, but also to have some continuity with the first patch
Data Inspired Music Model, Sunday 4pm
3. Night
Layer 1
Classic analog bell like sound, with a lower bass element. Has two waveforms:
an uneven triangle wave for the lower part of the sound, that sits legato underneath.
and a sine for the higher frequencies. The sine has a short attack and decay, then with volume automation slowly rises back in. There is also a unison widening the sound that gives it its fuller texture.
Layer 2&3
Again, this is then blended with same 2 layers (the ‘tube’ and ‘pop female ooh’ to thicken the sound. In their regard, the tube sound fills in the lower spectrum, and the female ‘ooh’ has a very slow attack time, and comes in when the note is held, bringing more depth in the mid to upper range after long legato notes.
Data Inspired Music Model, Sunday 8pm
Data Inspired Music Model, Sunday 10pm
The Data Inspired Music Model
In charge of making one of the two sonification systems, Elias created the “Data inspired music model”. This model were made using Python and several Python packages. The system is based on mapping parameters from CSV files (open city bike data) to the sounds that were created by Sam. The Python script would start by reading the CSV file, which were an arbitrary selected file from Oslo Bysykkels open data. The file selected consisted of data from all the bike trips in Oslo from a specific month. The data consists of 13 variables from each trip. The variables used in this model was the starting time of the bike trip, it’s duration and the latitude of the bike station. During the reading of this CSV file, the start/end date and time of the bike trips were converted to timestamps. Which are numbers of seconds since 1970. This makes it easier to get a grasp of the time between one bike being picked up and the next on the timeline. This is used to make the sounds being played in whatever time we select, but with the same amount of time between the different sounds in regard to the playback speed. The time would also be used to decide what sounds to play in regard of the different sounds depending on what time of the day it is. The latitude of the bike station decide what note to play. From lowest note furthest south to highest note furthest north. The duration of the bike trips decide if the model are going to play a long note or a short note. If the duration is below average duration, a short note is being played. If the duration if above the average duration the long note will be played. The duration of the bike trips also decide on the playback volume. Longer trips are played louder than the shorter one.
Parametric Sonification Model
Eigil made another way of sonifying the data from a CSV file using Max/MSP. This model used a similar way of extracting unix timecode from the start times of each line in the CSV file and then creating a delayed trigger within Max/MSP to read and parse the next line. By extracting parameters from the data such as length in meters, the average speed and duration, this can be played back almost like a score with different note events being changed by the parameters. Collecting all the necessary values and feeding them into a poly~ object makes it possible to generate multiple sounds layered on top of each other with the sounds being generated from the data. In this case, a note would have a lower pitch based on the average speed, and the pitch would rise according to the length of the trip. The duration of the sound is also mapped according to the duration of the trip, meaning if the playback is running at a factor of 1, the sound would take as long as the original trip took.
References
-
Thulinn, Samuel (2016). Sound maps matter: expanding cartophony https://www.tandfonline.com/doi/full/10.1080/14649365.2016.1266028
-
The future of Micromobility https://medium.com/urbansharing/what-this-years-sxsw-tells-us-about-the-future-of-micro-mobility-df2dbf521fb3
-
Composition With Path Musical Sonification Of Geo Referenced Data With Online Map Interface Park, S., Kim, S., Lee, S., Yeo, W.S., n.d. Composition With Path Musical Sonification Of Geo Referenced Data With Online Map Interface
-
Images from https://medium.com/@jonolave/exploring-open-data-from-oslo-city-bike-67985a101268
-
Sonic City: The Urban Environment as Musical Interface https://pdfs.semanticscholar.org/e3ab/f9dff14ca7c68b1ddeba113f982b512d6519.pdf
-
Online Map Interface for Creative and Interactive Music Making http://www.educ.dab.uts.edu.au/nime/PROCEEDINGS/papers/Demo%20N1-N20/P331_Park.pdf